The market repriced the bridge
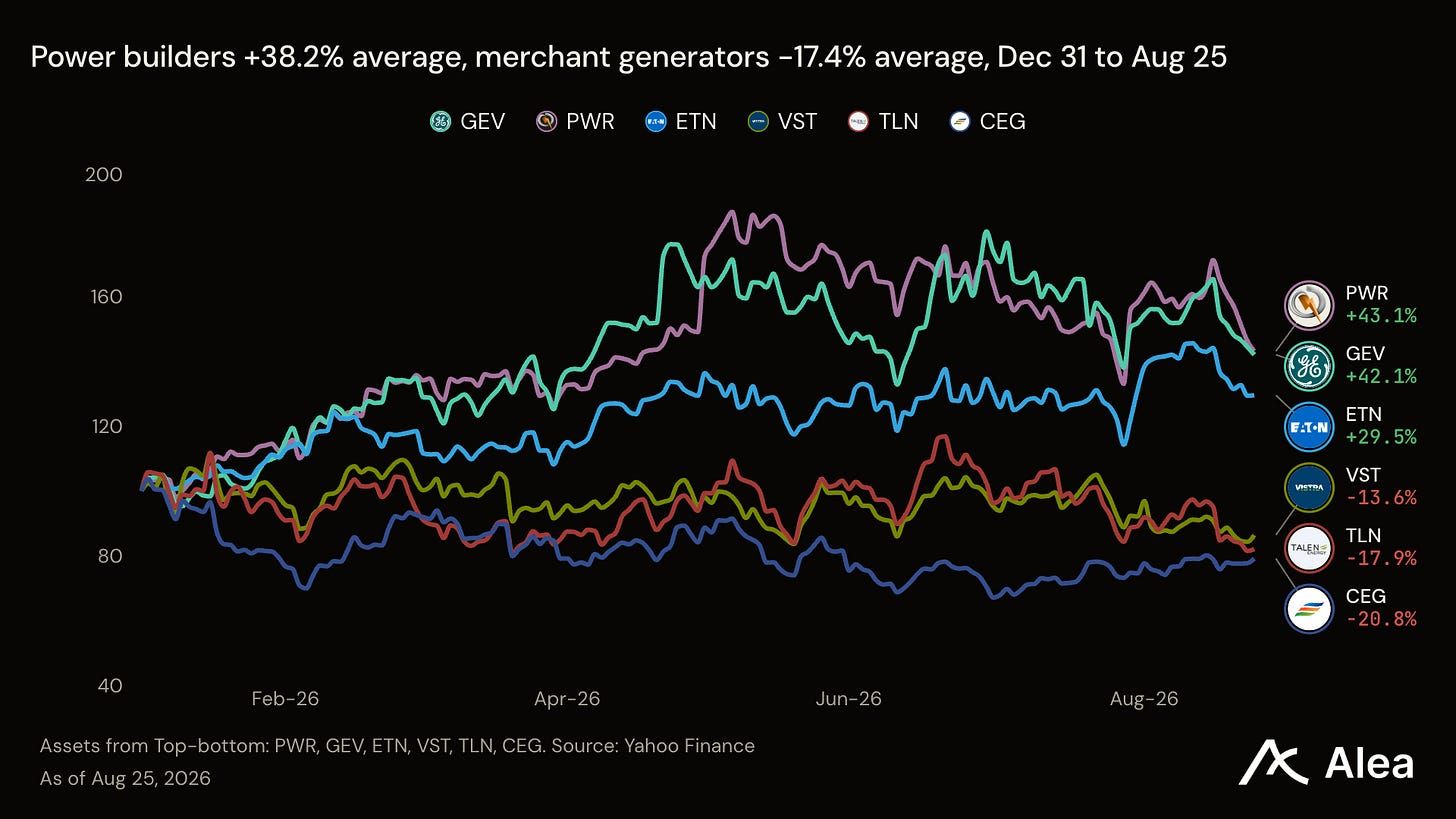
Every listed merchant power generator has lost money for its owners this year. From the Dec 31, 2025 close through Aug 25, 2026, total returns were -13.6% for Vistra, -17.9% for Talen, -20.8% for Constellation, and -28.0% for NRG. The S&P 500 returned 12.9% over the same span. Four names out of four fell in the group most directly associated with the AI-power thesis.
The other side of the trade kept compounding. Powell Industries returned 79.2%, Vertiv 57.9%, Quanta 43.1%, and GE Vernova 42.1%. They sell switchgear, cooling, labor, and turbines. They do not own a megawatt.
The market is rewarding companies that convert an order into cash while discounting those that must finance the years between a power agreement and revenue. That financing bridge, rather than electricity demand, now separates the winners from the laggards.
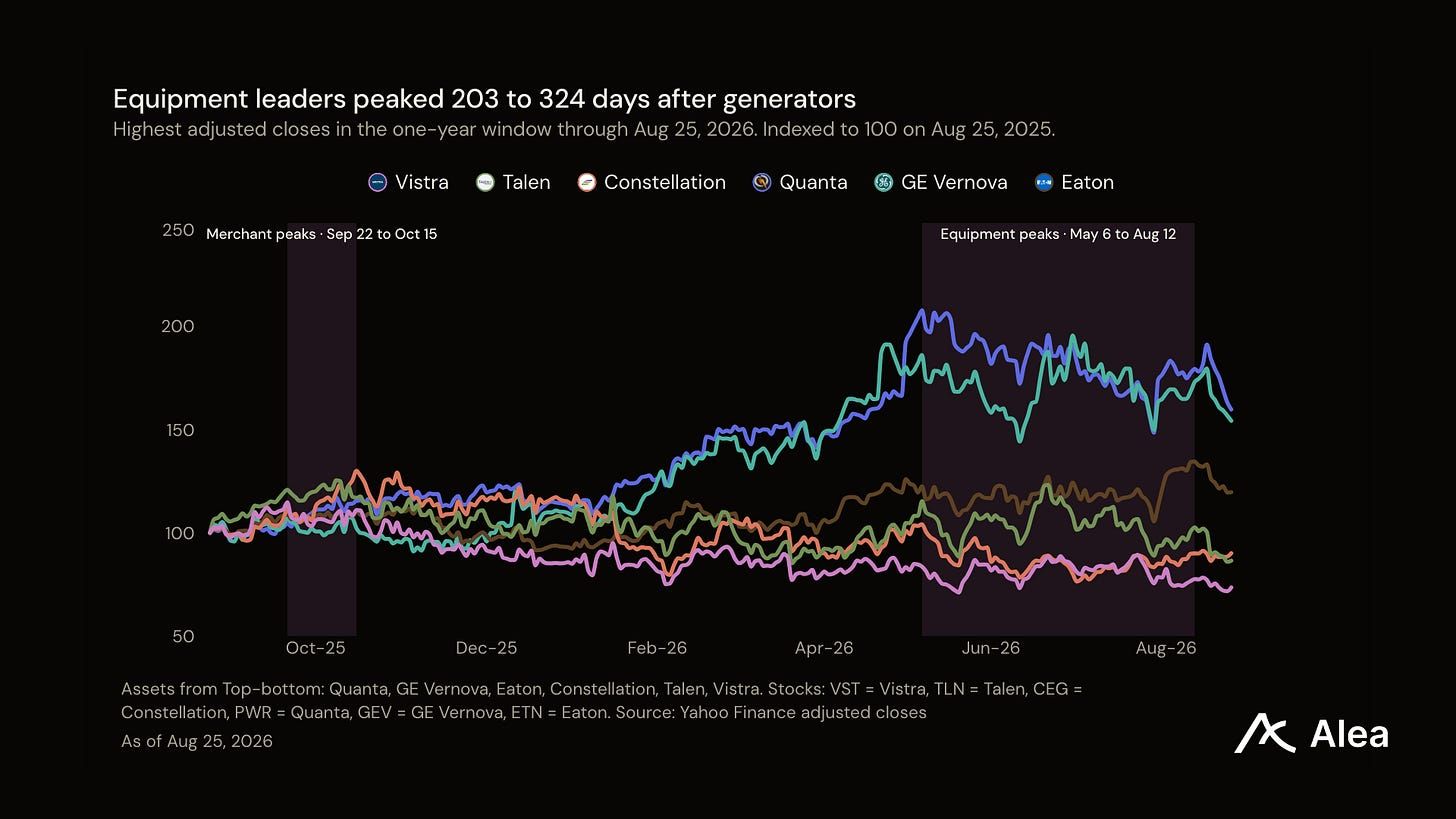
The repricing ran in sequence. Vistra peaked on Sep 22, 2025, Talen on Oct 3, and Constellation on Oct 15. Quanta kept rising until May 6, 2026, GE Vernova until Jul 6, and Eaton until Aug 12. The equipment names ran for another seven to ten months after the three generators topped.
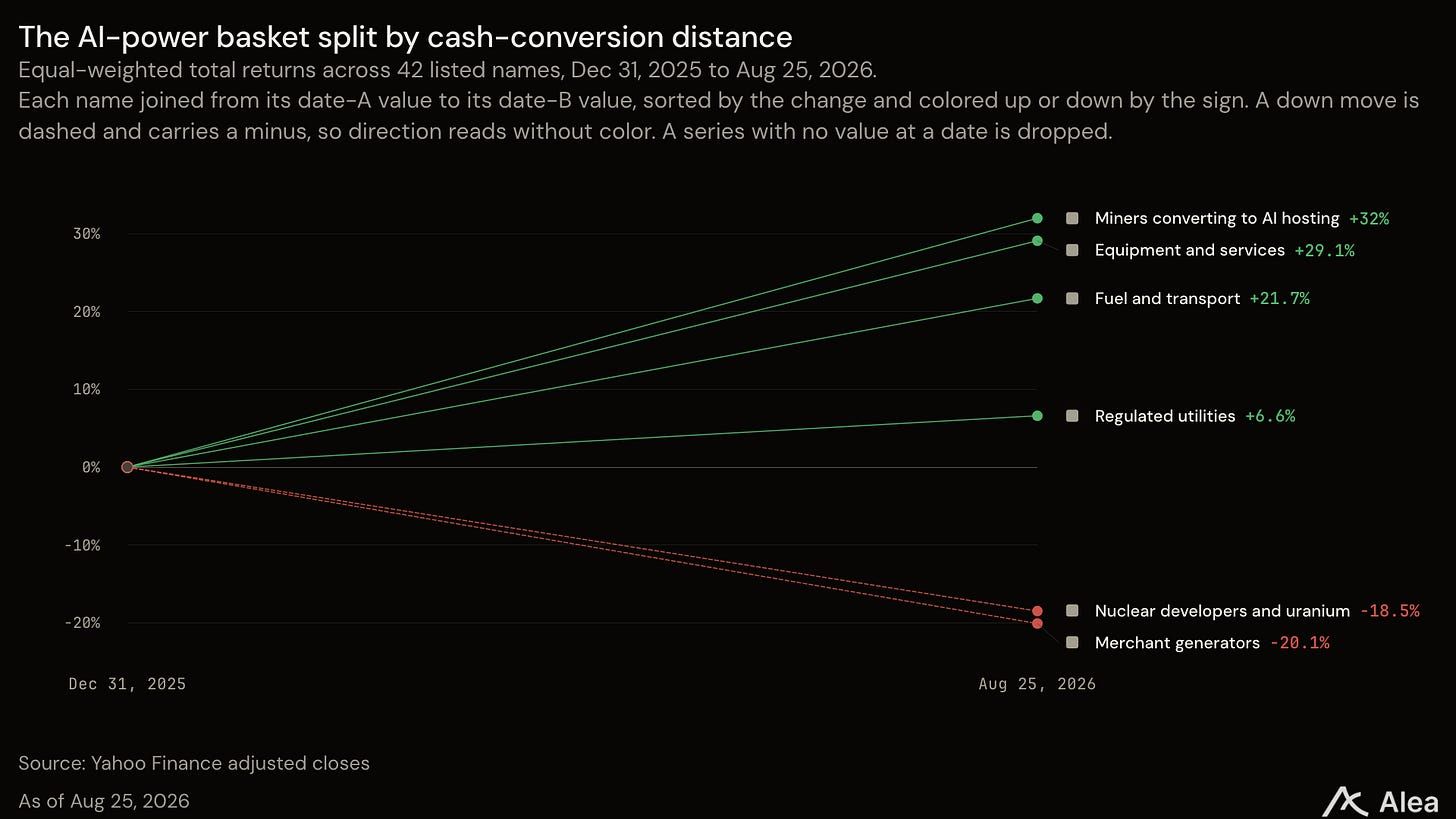
The broader cross-section supports the same reading. Across 42 listed names, miners converting to AI hosting returned 32.0%, equipment and services 29.1%, and fuel and transport 21.7%. Regulated utilities returned 6.6%, nuclear developers and uranium names lost 18.5%, and merchant generators lost 20.1%. These are equal-weighted group averages through Aug 25.
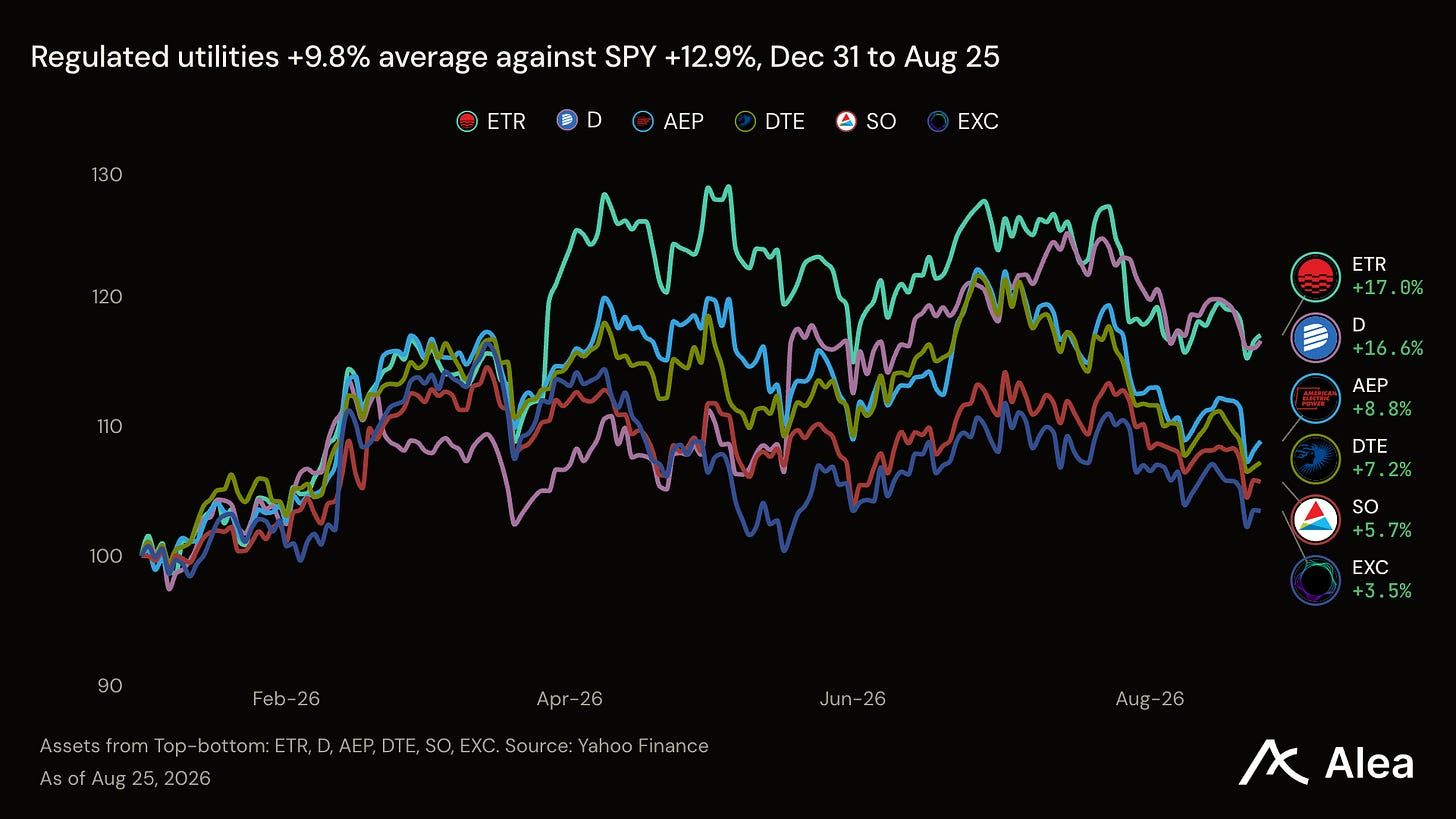
Regulated utilities are often ignored … until prices speak loud and their ticker can’t simply be ignored. They own generating assets, instead of a forward power curve, and that’s positive in certain market conditions where cash needs to be delivered fast and get that value reflected in the stock quickly. Entergy returned 17.0%, Dominion 16.6%, and American Electric Power 8.9%.
There are exceptions and outliers too.
Primoris experienced a 39.7% loss inside a positive build basket. On June 22, the company announced a cut to its 2026 adjusted EBITDA guidance after finding additional overruns and delays on six renewable projects. The new range was $275M to $325M, down from $480M to $500M, which reduced the midpoint by 38.8%.
Primoris later reported that second-quarter Energy gross margin fell from 10.8% to -0.3% as redesigns, sequencing changes, lower labor productivity, subsurface problems, and bad weather raised costs. Total backlog still reached a record $13.9B. The guidance reset and margin collapse are the strongest operating explanations for the stock’s divergence. Again, record orders did not convert into profit.
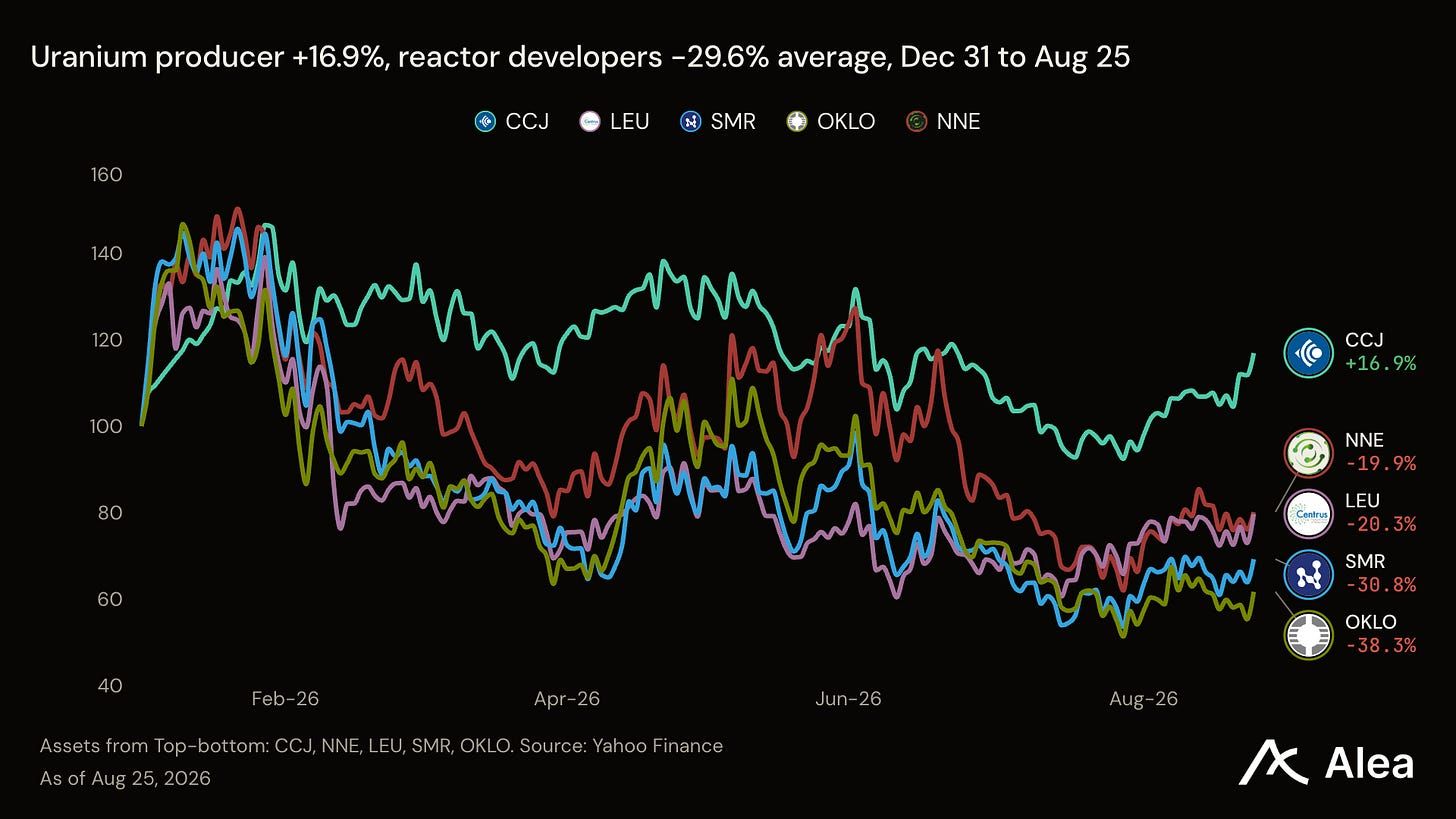
Cameco, on the contrary, returned 16.9% inside a negative nuclear basket after the company reported second-quarter consolidated adjusted EBITDA of C$391M, down from C$673M because the prior-year period included a US$170M Westinghouse contribution. Yet average realized uranium prices rose, annual production guidance held, and Cameco had contracts for more than 28M pounds a year over the next five years with market-related pricing.
In March, Cameco entered a nine-year agreement to supply India with nearly 22M pounds from 2027, worth an estimated C$2.6B at the February uranium reference price. Cameco also announced that Westinghouse had confidentially submitted a draft registration statement for a proposed IPO on July 31. Investors had current uranium revenue and market-linked contracts. The Westinghouse IPO process added possible valuation upside while reactor developers still had to fund licensing and construction. The two exceptions refine the thesis. Current contracts, therefore, help only when companies can deliver them at a profit.
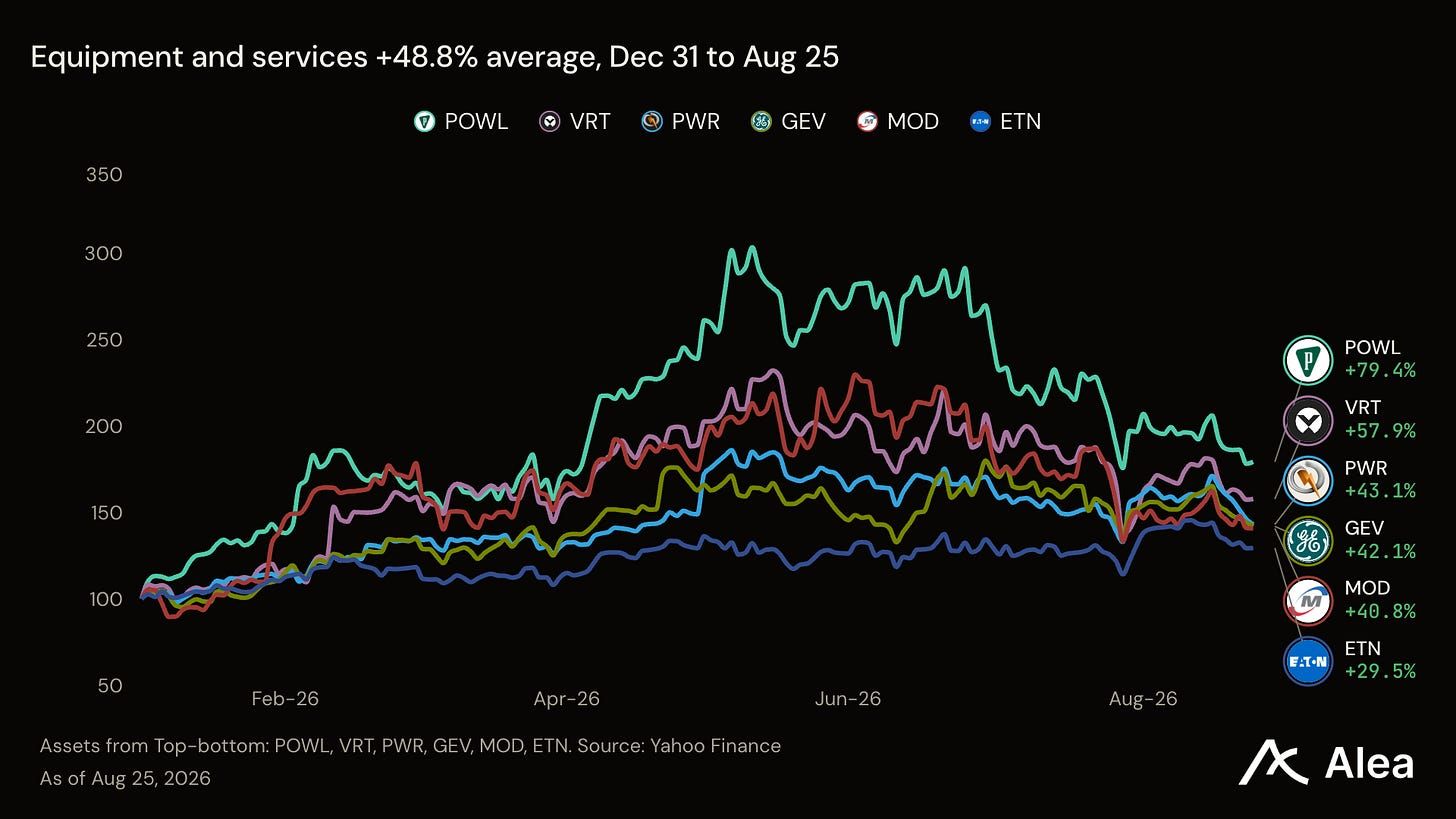
Delivery gets paid; duration discounted
A turbine order converts into revenue and cash as soon as the equipment is shipped. An owned megawatt under a long-term power purchase agreement, however, can require years of construction, interest expense, and equity funding before the first dollar lands on the bank.
GE Vernova manufactures turbines and grid equipment. It reported $24.2B of second-quarter orders, up 88% organically, and a $13.0B sequential increase in backlog. Gas Power equipment backlog and slot reservations reached 116 GW. It generated $5.1B of quarterly free cash flow. In its 10-Q, the company filed an $11.7B first-half working-capital inflow, including $13.7B from contract liabilities and deferred income tied mainly to Power down payments and slot reservations. Customers financed the production queue before shipment. GE Vernova still owes equipment and services against those advances.
Quanta builds and maintains grid, generation, and load-center infrastructure with its own crews. It reported $9.56B of second-quarter revenue, up 41.1%, and $0.9B of free cash flow. About $23.5B, or 70.1%, of its $33.6B in remaining performance obligations is expected within 12 months. Those obligations primarily represent firm fixed-price orders. The Electric segment supplied 82.0% of revenue, and its operating margin rose from 10.1% to 11.5%. Quanta still carries execution risk, but near-term contracted work and expanding margins show that crews are converting backlog into revenue.
Eaton sells switchgear and other power-management equipment. It reported $8.5B of second-quarter sales, up 21%, with 14% organic growth. Free cash flow rose 22% to $874M. Electrical backlog grew 43%, and the electrical book-to-bill held at 1.2. Electrical Americas margin reached 27.5%, up 190 bp sequentially. Eaton announced that its manufacturing investments have exceeded $1.5B since 2023 and that it is adding a Nebraska switchgear plant for 2027. Eaton must use that capacity to turn backlog into shipments without giving up margin.
Cash reaches these companies before a power owner operates a new megawatt. Customers advance cash to GE Vernova, Quanta completes contracted work due within a year, and Eaton ships electrical equipment against a book-to-bill above 1.0. Their remaining risk is whether they can deliver at the quoted price and on schedule.
Meanwhile, Constellation announced 920 MW of new power purchase agreements with investment-grade customers on 15- to 20-year terms. Those contracts begin between 2029 and 2032. The company also raised full-year adjusted earnings guidance to $11.50 to $12.50 per share, and its stock lost 20.8% through Aug 25.
Both sides have evidence. The mismatch is whether equity holders are paid enough to carry the interval between a signed megawatt and operating cash flow.
Who is writing the check
Five of the nine companies most associated with the power thesis paired 2026 growth with outside partners, asset sales, new shares, or new debt.
Williams secured $5.34B of committed capital from Blackstone, Apollo, and KKR vehicles in exchange for a 49% noncontrolling interest in five behind-the-meter projects. The commitment covers $4.4B, or 49%, of expected growth capital expenditures and includes about $0.9B of additional consideration. Williams kept 51% and operating control.
Vistra established Helix Digital Infrastructure with KKR, the Kuwait Investment Authority, and NVIDIA. Vistra made an initial commitment of up to $1.0B.
TeraWulf agreed to sell its entire 50.1% interest in the Abernathy joint venture for about $530M.
Constellation paid for Calpine with 50M newly issued shares and $4.5B in cash. Former Calpine owners received about 13.8% of Constellation’s outstanding stock after the merger.
Talen issued $4.0B of notes in April at 6.125% and 6.375%. It used the proceeds for the Cornerstone acquisition and to redeem $1.2B of older notes. Long-term debt rose from $6.78B to $9.54B in six months, a 40.7% increase.
New capacity requires financing before it earns revenue. Williams and TeraWulf sold part of the project economics. Constellation added 50M shares. Talen increased long-term debt by $2.76B, while Vistra brought strategic partners into Helix. The common funding need did not produce a common stock return.
Talen shows what a debt bridge costs. Second-quarter interest expense reached $214M against $374M of adjusted EBITDA, up from $62M a year earlier. Talen posted a $92M GAAP net loss in the same quarter it raised guidance.
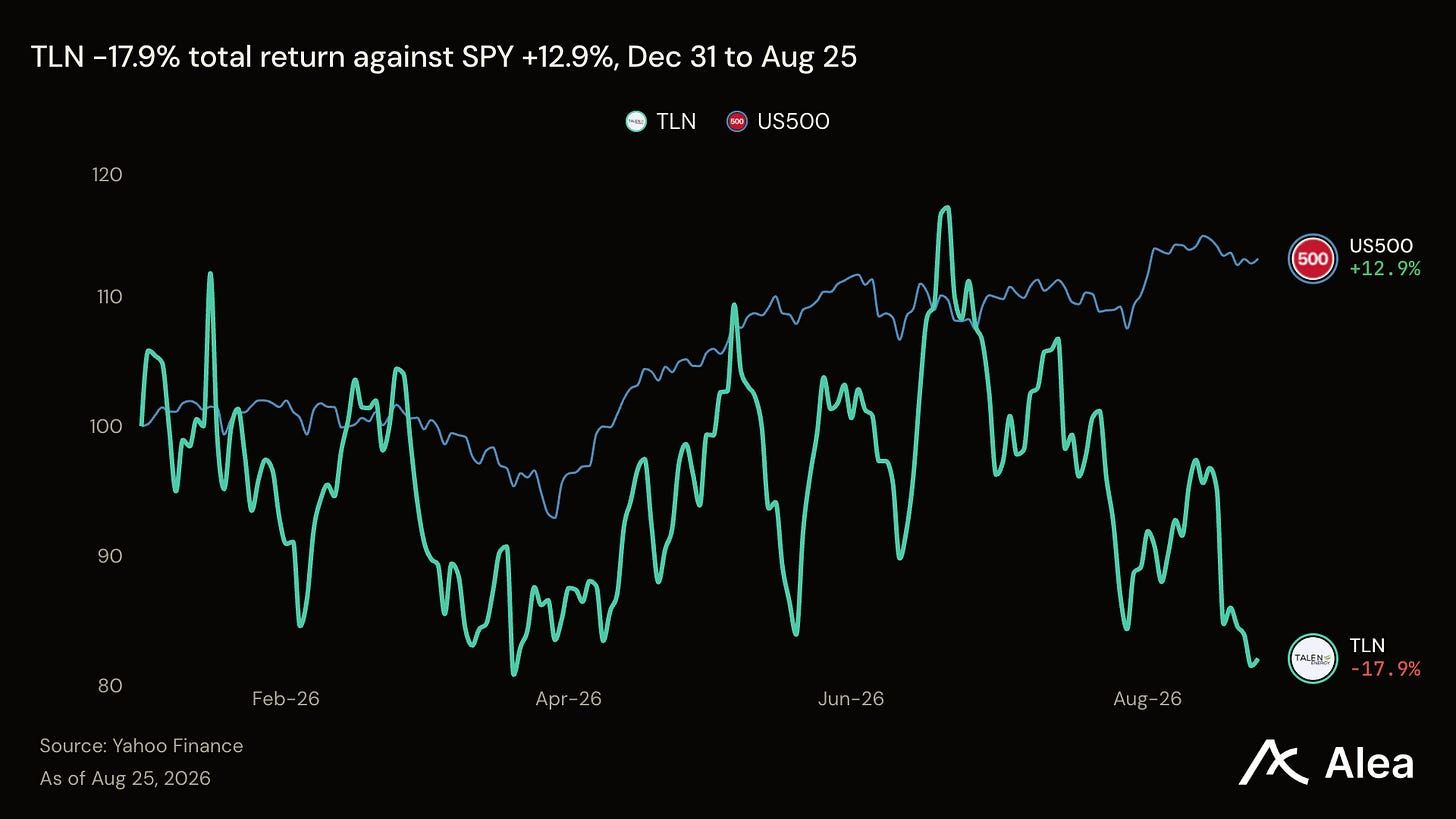
Homer City puts the split inside one project. A 2 GW coal plant closed in 2023, and a 4.4 GW gas campus is scheduled to replace it. GE Vernova confirmed a firm order for seven 7HA.02 turbines, with first deliveries in 2026. Homer City Redevelopment announced EQT as its exclusive gas partner under an agreement in principle for up to 665,000 MMBtu per day. That announcement dates to Jul 15, 2025; no definitive agreement has been announced publicly.
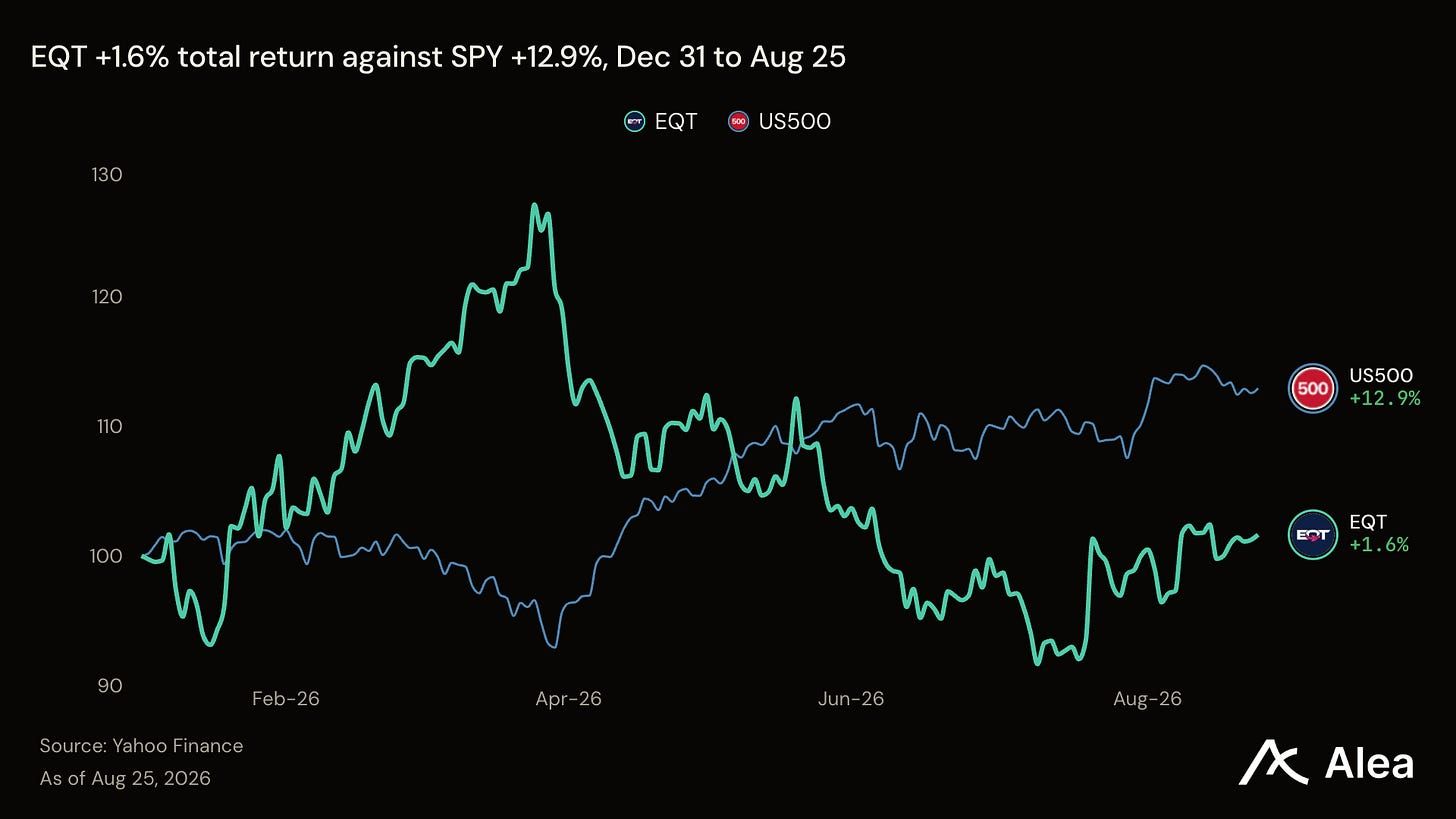
Compare them side by side: one counterparty holds a finalized equipment order; the other holds an intention. GE Vernova returned 42.1%; EQT returned 1.6%. The spread is consistent with a market preference for contracted delivery over an unresolved input agreement.
What the consensus overlooks
The merchant bull case is coherent. These companies own scarce, dispatchable capacity during a demand shock, and their valuation multiples do not require the growth assumptions embedded in equipment suppliers. For example, Vistra reported that its 2026 guidance and 2027 opportunity range of $7.4B to $7.8B exclude Cogentrix and the signed Meta agreements. Real AI contracts sit outside the figures investors are discounting today. Simultaneously, the hedge book limits the near-term payoff. As of Aug 3, Vistra had sold about 100% of expected 2026 generation, 94% of 2027, and 72% of 2028. Those hedges protect cash flow, but they also cap participation in the power-price move behind the scarcity thesis.
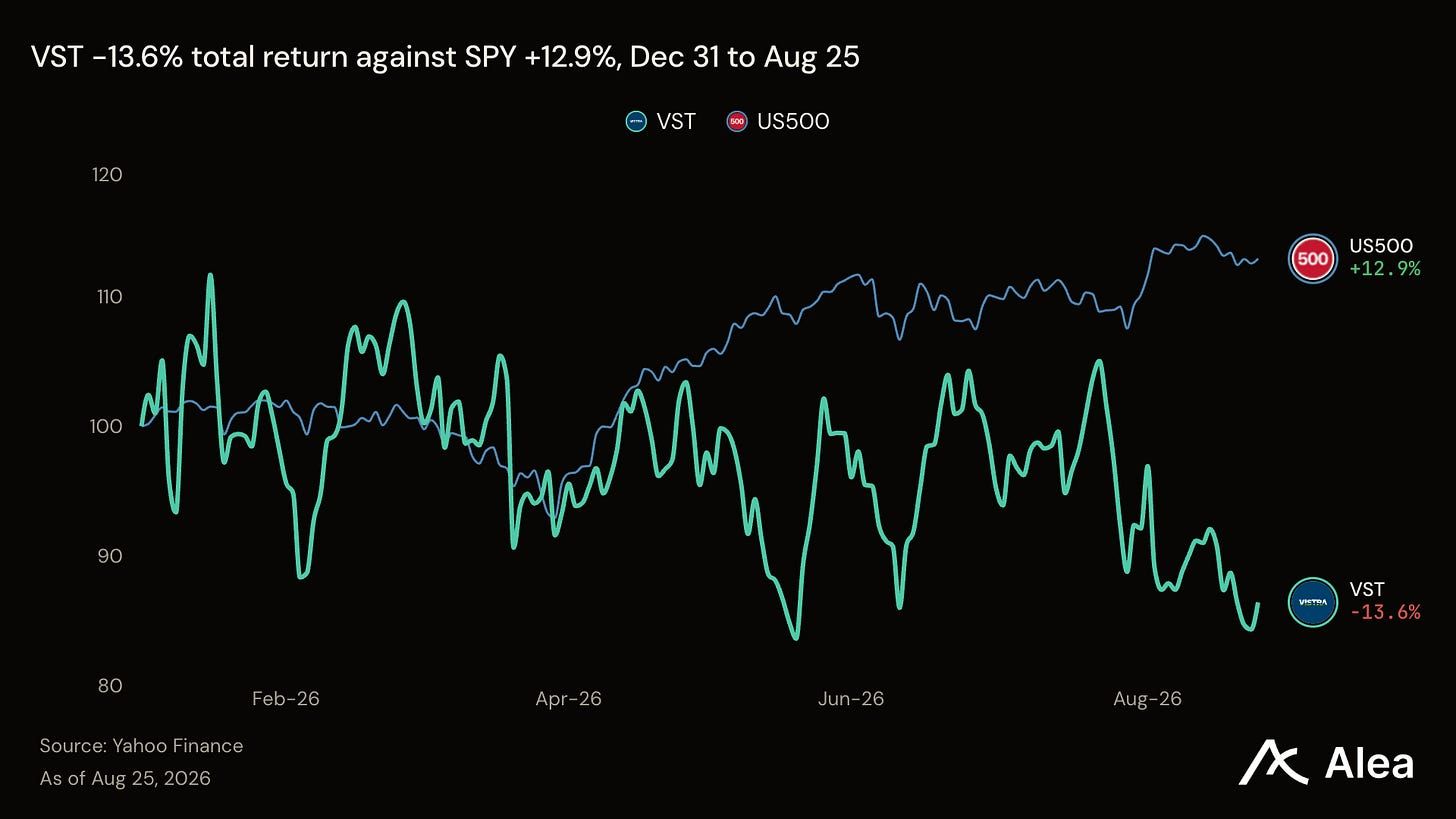
The hedge book is the clock
Nuclear equities show the same distinction between present delivery and distant duration. Cameco returned 16.9% while pre-revenue reactor developers lost 29.6% on average. One sells uranium into current contracts; the others must fund licensing, construction, and commissioning before revenue.
TeraWulf provides the sharpest test. The company reported an Anthropic lease worth about $19B over 20 years for 401 MW of capacity. That averages $950M of annual contracted revenue. Management estimates construction at $8M to $10M per critical IT megawatt, or $3.2B to $4.0B in total, against a market value near $8B. First revenue is scheduled for the second half of 2027.
The power trade now rewards short cash conversion and discounts anyone who must finance the wait. While equipment vendors lock orders, collect deposits, and recognize cash as they deliver, merchant generators carry interest expense, dilution, and joint-venture leakage before contracted demand begins to pay.
Case in point: Vistra has already sold 72% of expected 2028 generation. When that book rolls, forward power prices and the cost of funding new capacity will decide whether merchant generators were cheap or correctly discounted.
Important Links

Put the power trade in a wider market context with Alea’s Weekly Pulse. Some editions require an Alea membership.
Research reports. Deep Dives and Blueprints explain protocols and their economics. Theses and Memos examine investment cases and catalysts. Benchmarks compare performance, while Perspectives assess specific developments.
Weekly Pulse. Read a weekly assessment of macro and the major liquid markets.
Protocol Data Rooms. Research each protocol in one place, with Analytics for historical comparisons and Intel for news and governance developments where available.
Podcast Digest and Summit Digest. Read summaries of industry conversations and events. Find Alea shows and their episodes through Podcast Digest.
Governance Tracker. Follow proposals and voting activity across protocols.
For protocol teams preparing institutional conversations, discuss research for your protocol with Alea.