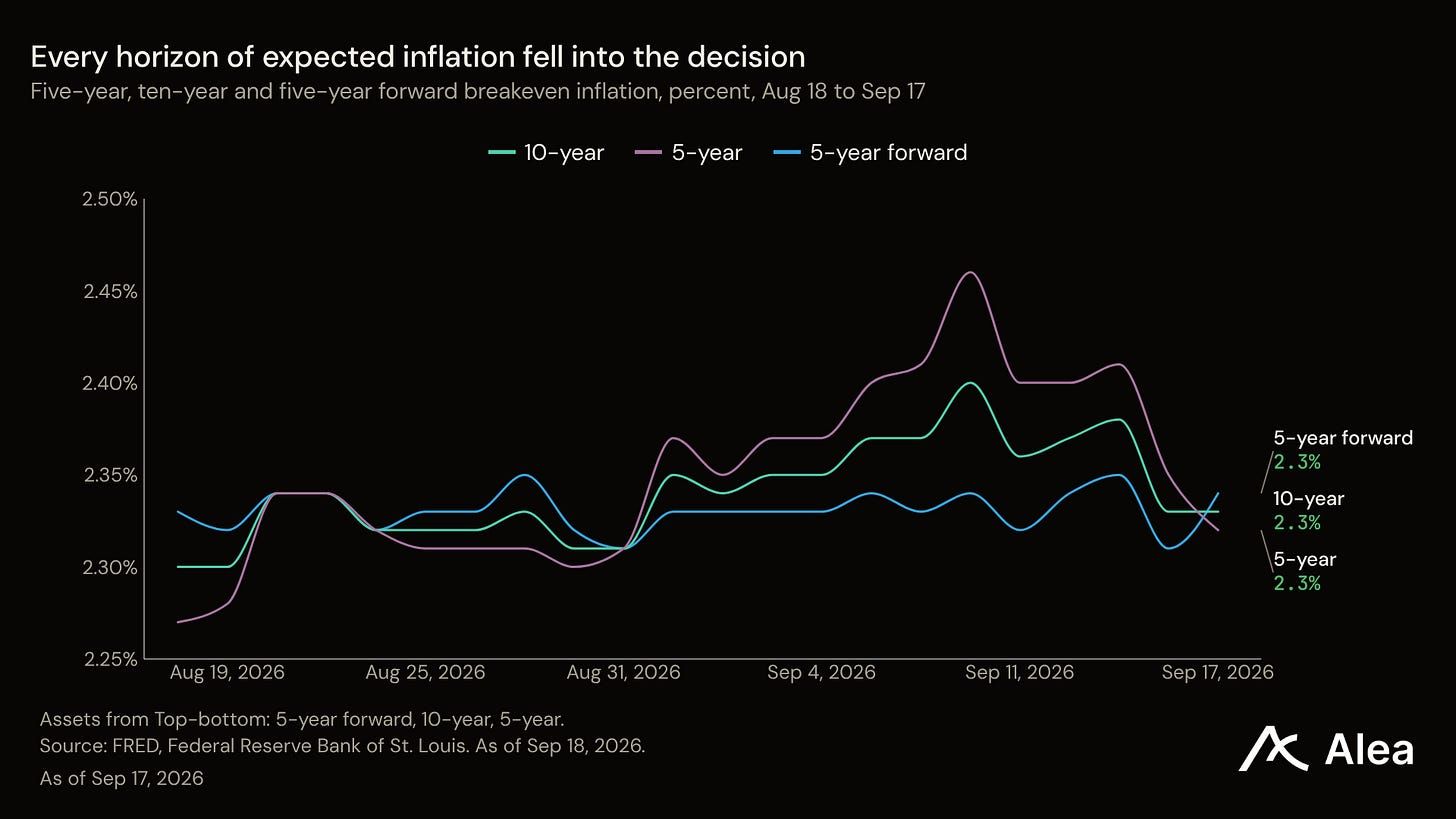
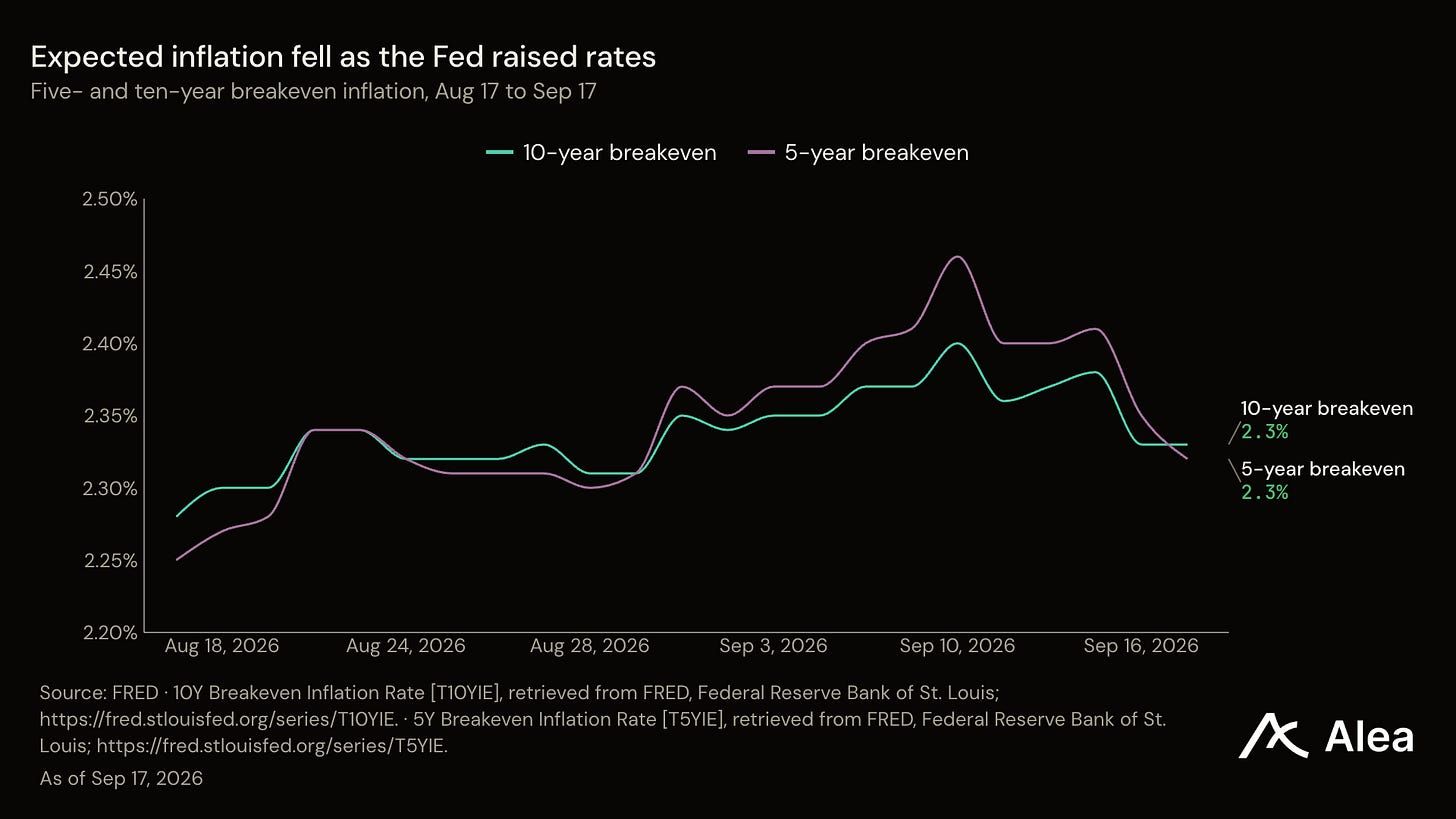
Monday, crude was the only trade that mattered. WTI printed $105.83 and the ten-year touched 5.01%, a level the daily series had not seen since July 2007. By Friday’s close crude sat at $95.96, the ten-year was back under 4.95%, and the best week in the market belonged to Solana at +13.22%. Nothing in between required a growth scare. The Fed raised its target range to 3.75-4.00% on Wednesday, and the bond market answered by marking inflation down at every horizon rather than up. Five-year compensation fell to 2.32% from 2.40%. That is what an accepted rate rise looks like, and it is why the oil trade lost its meaning before it lost its price.
Key Takeaways
The Fed raised rates and expected inflation fell. Five-year compensation dropped to 2.32% from 2.40%, and every tenor out to thirty years fell with it.
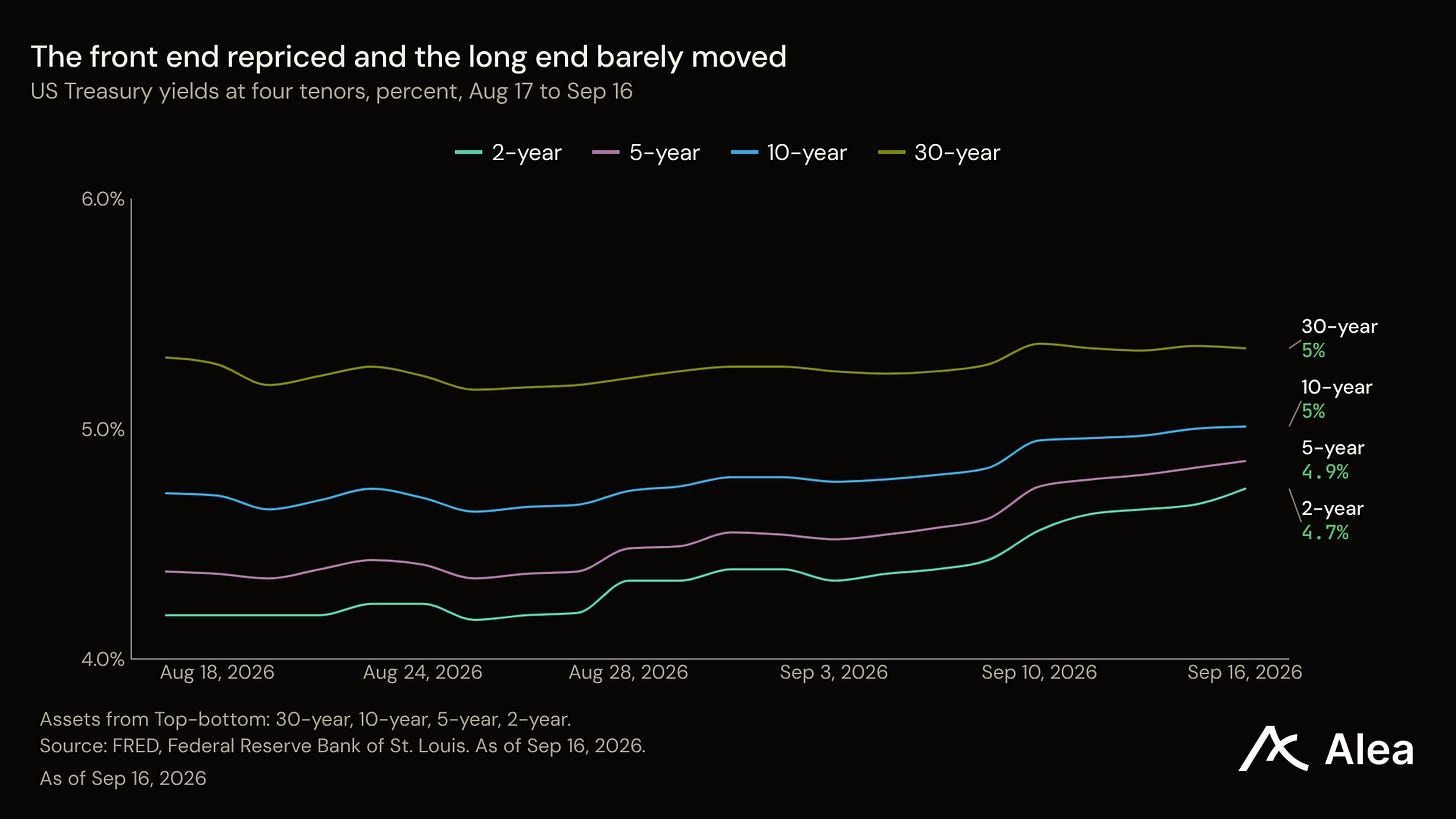
Five percent lasted two sessions. The ten-year closed at 5.00% on Sep 15 and 5.01% on Sep 16, the first prints at or above five since July 19, 2007, then gave it back. Nobody defended the level after FOMC.
Crude gave back a month in four sessions. WTI fell -9.4% from Monday’s $105.83 to $95.96, turning a +13.56% month into a -4.09% week.
Crypto took the week and it was a squeeze, not conviction. SOL +13.22%, ETH +6.51%, BTC +5.41%, with $62.6M of BTC shorts liquidated on Friday against $2.1M of longs.
The small-cap index paid for all of it. Russell 2000 -1.82% on the week and -6.75% on the month, against a Nasdaq 100 that finished +0.31%.
Last Week’s View
Last week showed that the predictions markets crowd had September priced right.
The rise came; the Fed moved to 3.75-4.00% on Sep 16; the crowd had it at 87.5% two days out, up from 79.5% on Sep 14, and August retail sales at +1.2% against a 0.8% consensus did the repricing.
In macro, breakevens fell at every tenor and the long bond rallied into the decision.
In equities, energy shares were the worst sector at a -3.01% median in the same week the barrel rose, which is not what investors do when they believe an oil shock will last.
In commodities, the barrel itself has now handed the month back, down -9.4% from Monday.
In crypto, the only asset class that actually rose, the move was a short squeeze with no inflation content at all.
And in rates, the five-year real yield rose +8bps while its inflation leg fell by the same amount, which shows how the market repriced the cost of money and not the price level.
Cross-Asset
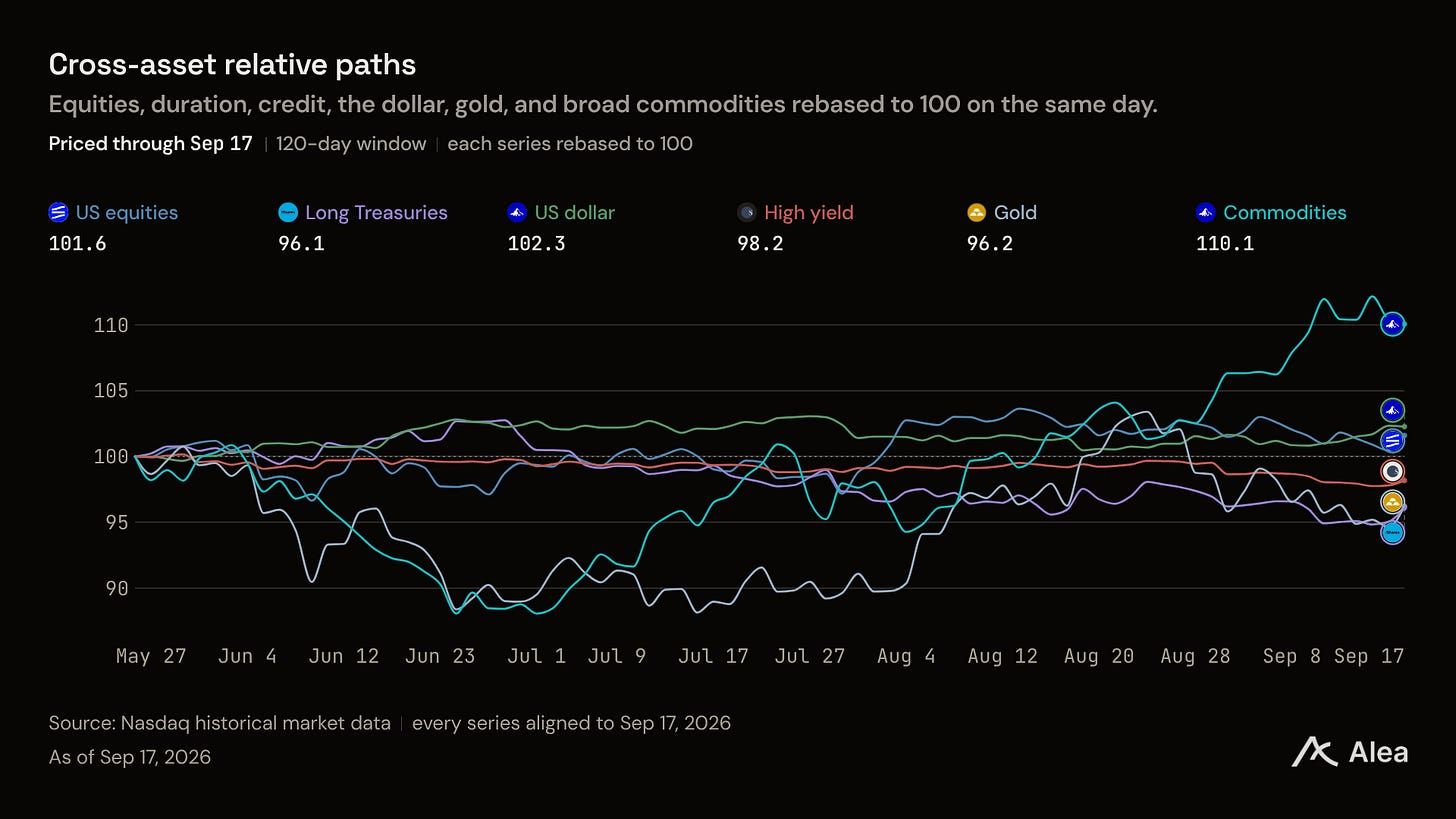
Majors, Sep 11 close to Sep 18 close. SOL +13.22%, ETH +6.51%, BTC +5.41%, natural gas +3.14%, copper +3.53%, gold +0.34%, Nasdaq 100 +0.31%, S&P 500 -0.42%, Russell 2000 -1.82%, WTI -4.09%, Brent -5.33%.
Rates and dollar. Through Thursday the five-year was unchanged, the ten-year fell -2bps and the thirty-year fell -6bps, while the two-year rose +4bps. The 2s10s slope narrowed 6bps to 27bps and 2s30s narrowed 10bps to 62bps. The dollar index rose +1.15% to 100.26.
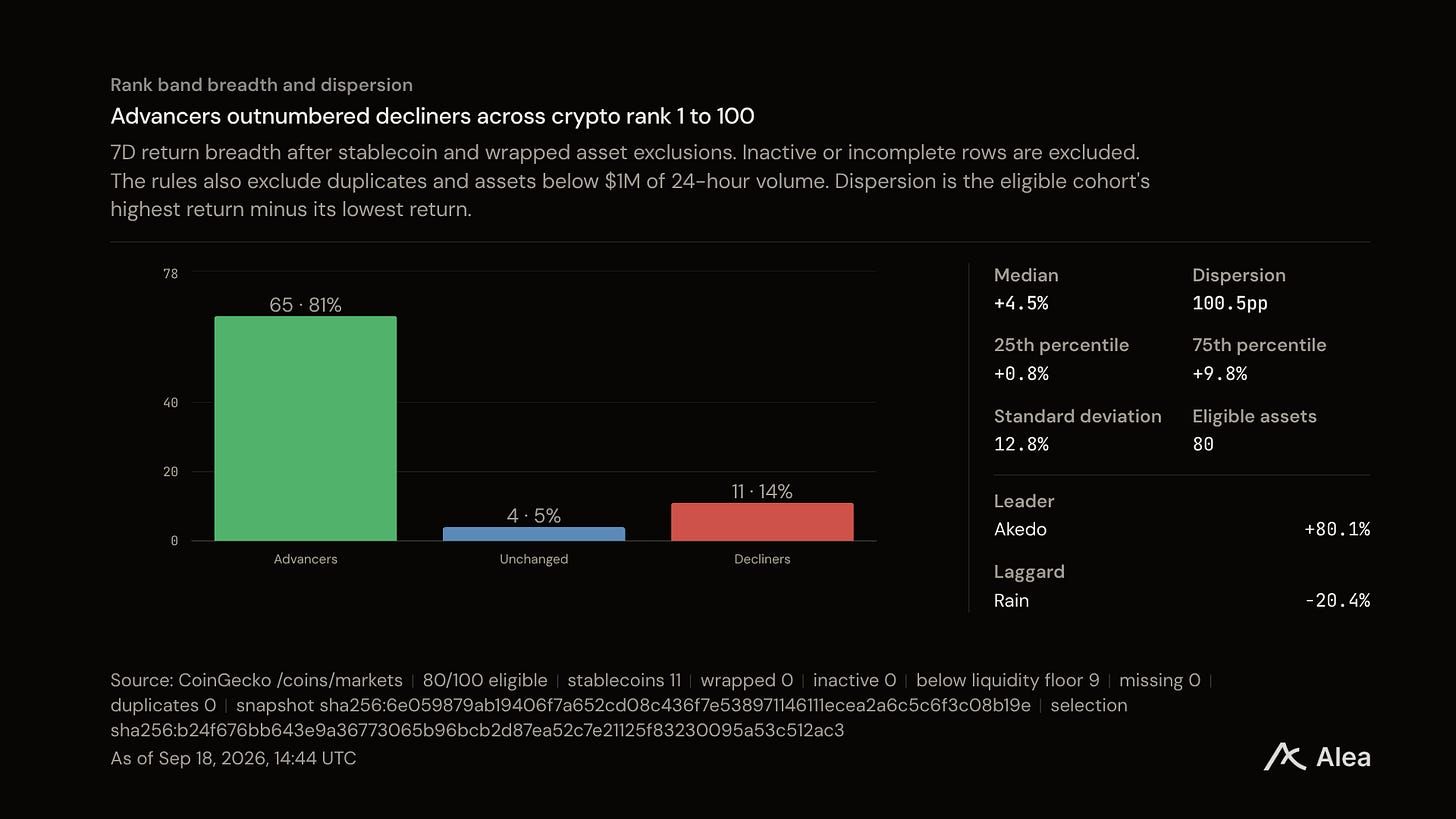
Breadth. Crypto: 65 of the non-pegged top-100 assets rose against 11 that fell, on a median of +4.5%. Equities: 173 of 503 S&P 500 members rose through Thursday, or 34%, against a median member down -1.13%. Commodities: the complex split, with the grains and industrial metals up and the whole energy strip down.
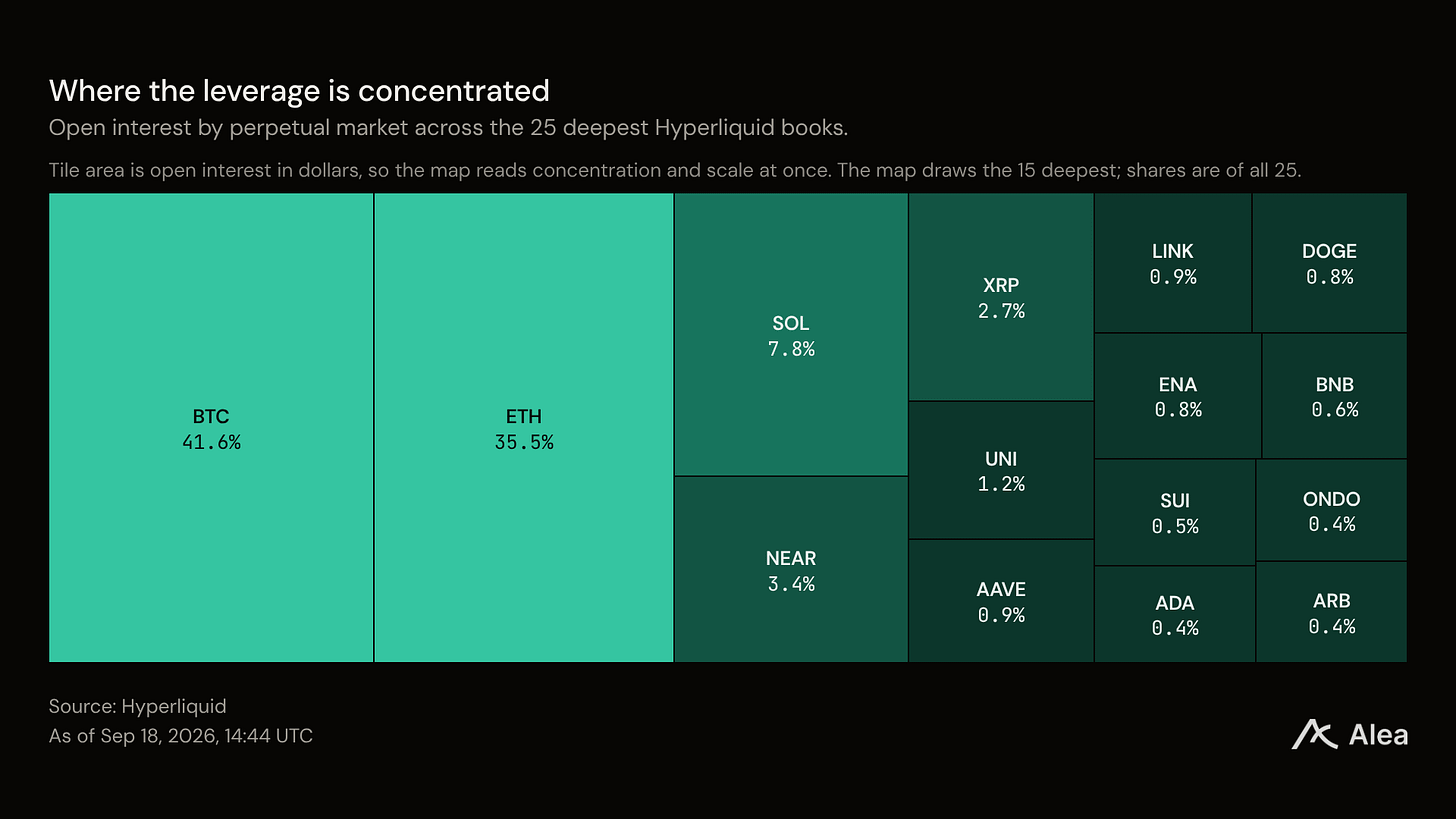
Positioning. Open interest is counted in contracts, so the price move is stripped out. Binance’s BTCUSDT perpetual open interest rose to 109,569 BTC. Hyperliquid’s ran from 36,940 BTC to 41,218 BTC. Longs paid throughout. Binance charged +0.117% across 21 settlements, every one positive. Hyperliquid charged +0.141% across 168 hourly settlements.
Macro
The Fed moved its target range to 3.75-4.00% on Sep 16, effective the following day.
For two sessions the ten-year traded like a regime change. It closed at 5.00% on Sep 15 and 5.01% on Sep 16. The daily series had not printed at or above five percent since July 19, 2007, when it closed at 5.04%. Then it went away. By Thursday the ten-year was at 4.94%, down -2bps on the week, and the thirty-year had fallen -6bps to 5.29%. A level that lasted nineteen years to reach lasted two sessions to hold.
Every measure of expected inflation fell with it. Five-year compensation dropped to 2.32% from 2.40%, ten-year to 2.33% from 2.36%, thirty-year to 2.25% from 2.28%. The real yield did the opposite at the front. The five-year real rate rose +8bps while its inflation component fell by the same amount, leaving the nominal five-year exactly where it started.
The market did not reprice the price level. It repriced the cost of money.
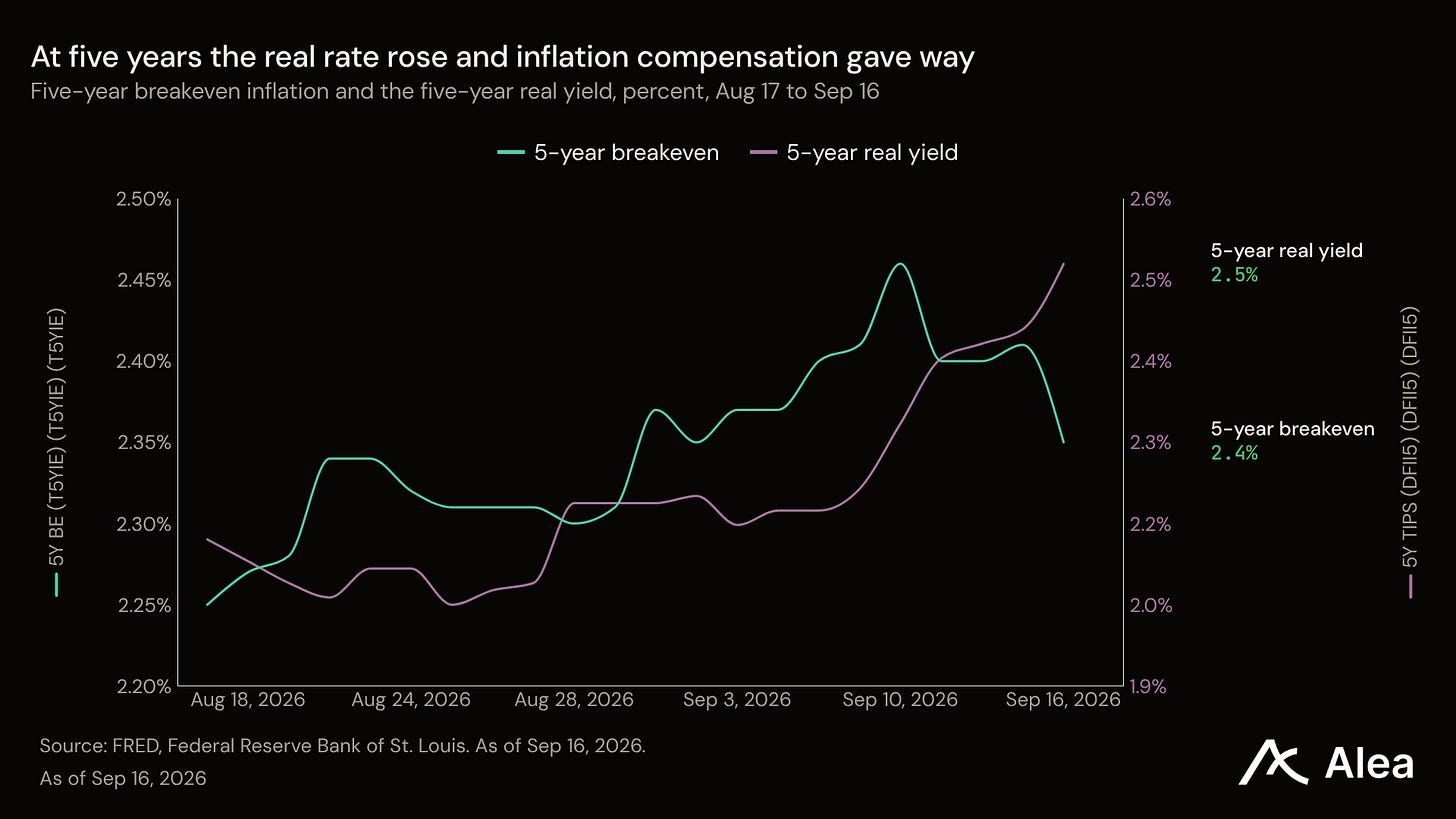
A market pricing a policy mistake sells the long end and lifts inflation compensation. This market bought the long end and cut inflation compensation at every horizon. The thirty-year and the twenty-year each fell -6bps while the two-year rose +4bps and the three-year rose +6bps. The curve flattened from the front, which is what a credible tightening looks like.
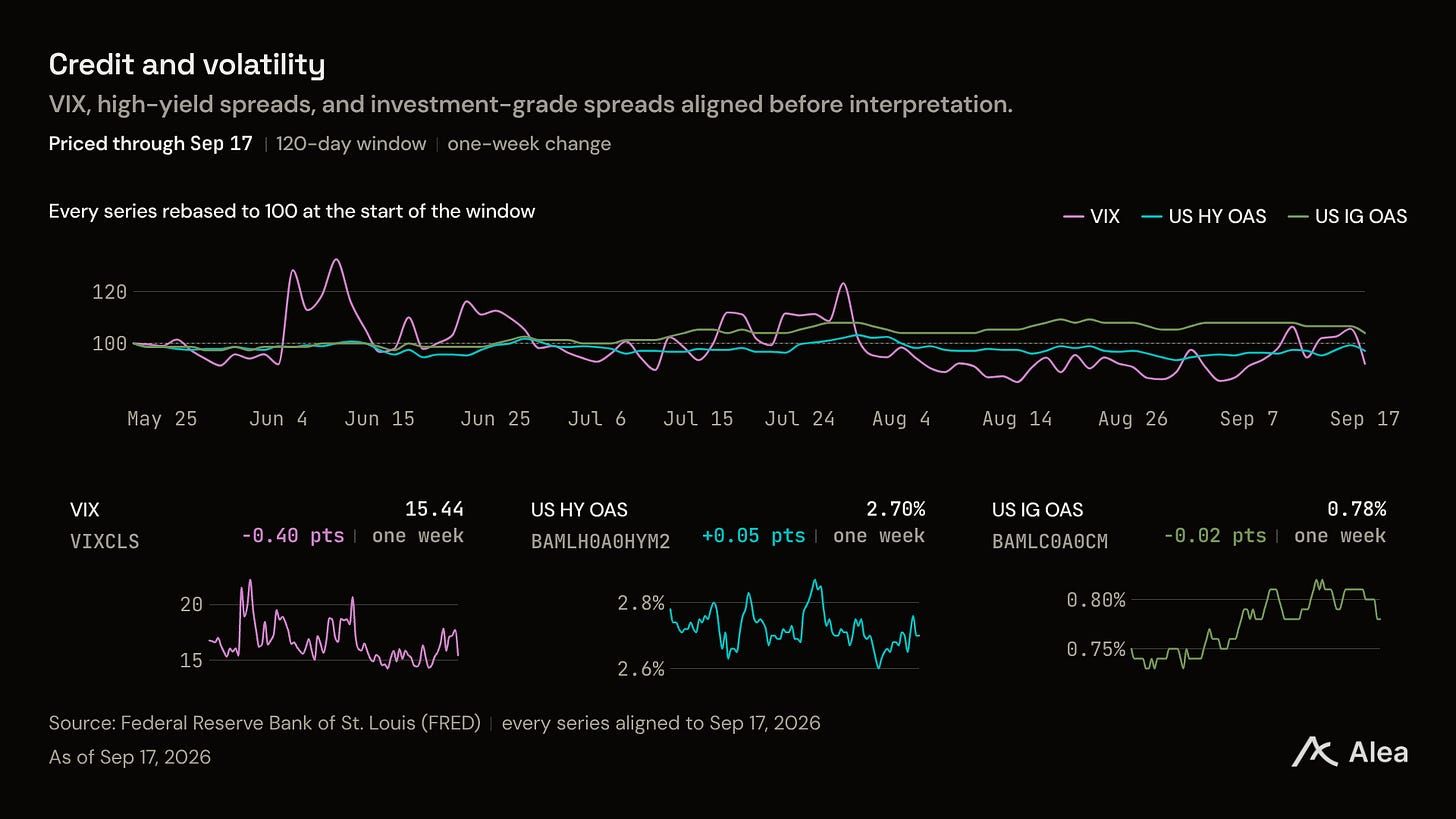
The rival explanation is a growth scare, which would also cut inflation compensation and bid the long end. Three things argue against it. The front end rose rather than fell. Credit did not move: high-yield spreads ended at 2.70% and investment grade at 0.78%, both inside their own two-week range. And volatility fell, with the VIX closing the week at 15.39 against 15.84 where it started, after spiking to 17.71 on the day of the decision.
Crypto
Crypto was the only asset class that took the week, and it took it in one session. SOL rose +13.22%, ETH +6.51% and BTC +5.41% from the Sep 11 close, and almost all of it landed on Friday: SOL +9.94%, ETH +6.13%, BTC +5.66% after Thursday’s close.
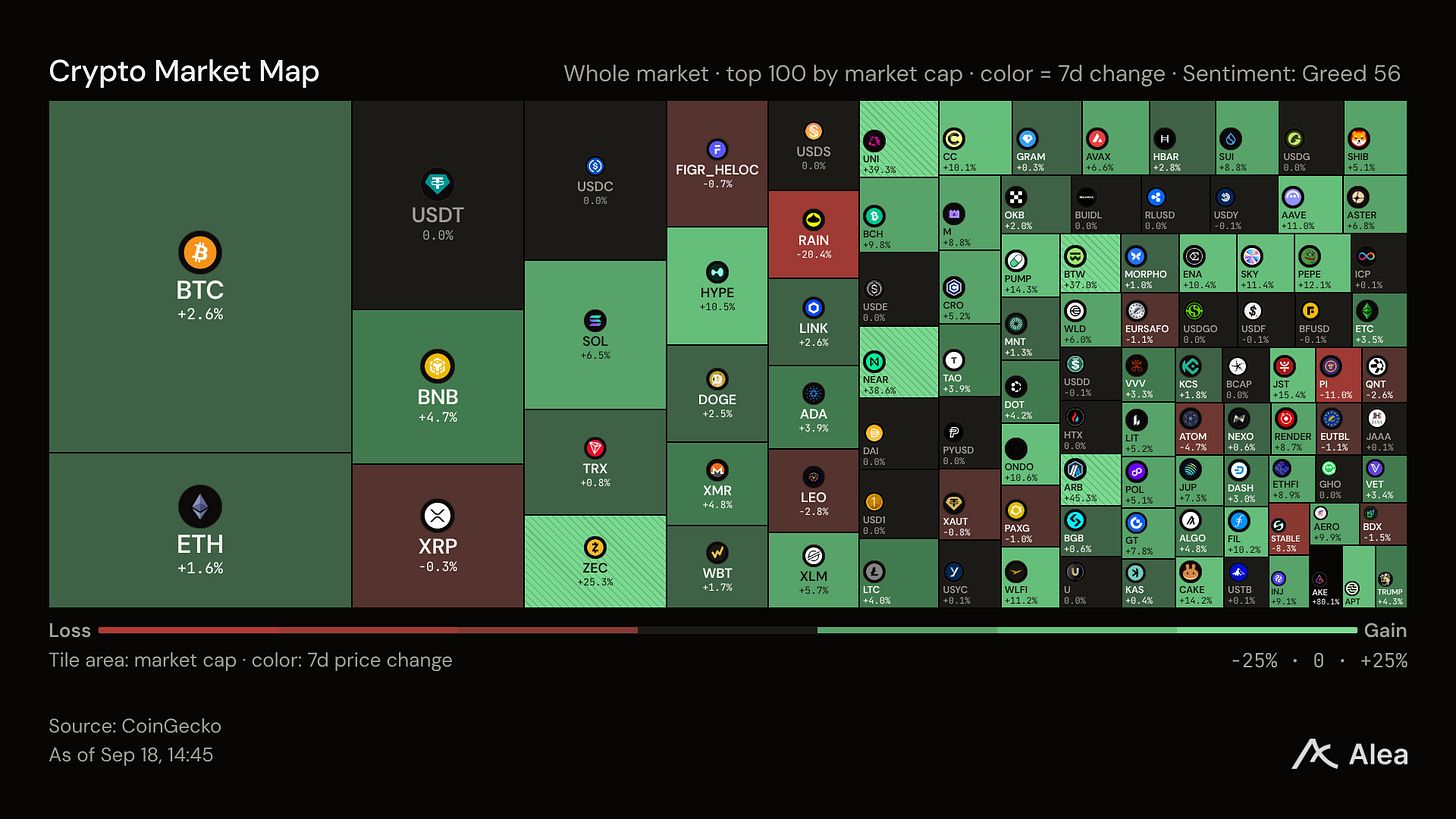
The rally is broad rather than led. 65 of the eligible top-100 assets are higher against 11 lower, on a median of +4.5%. Dispersion is 100.5pp between the best and worst; selection still decides the outcome inside a green market.
The flows had already turned before the price did. US spot BTC funds redeemed $440.1M across five sessions. The two largest redemption days were Sep 15 and Sep 16, the session before the decision and the session of it. On Sep 17, the day after, they took in $159.5M. ETH funds followed the same shape at smaller size, ending the week $68.2M lighter.
Friday’s move was a short squeeze, not new conviction. Realized liquidations on Binance’s BTC perpetual ran $62.6M of shorts against $2.1M of longs. That inverts the reporting week, when longs lost $154.1M against $94.3M of shorts. Hyperliquid open interest added +14.97% in contracts on the day, to 41,218 BTC; leverage arrived after the move rather than driving it. The perpetual holds only a +0.04% premium to spot, and funding annualises at 6.4% on Binance and 7.6% on Hyperliquid.
Equities
The S&P 500 fell -0.42% and the Nasdaq 100 rose +0.31%, while the Russell 2000 fell -1.82% on the week and -6.75% on the month. Through Thursday only 173 of 503 S&P members rose, and the median member fell -1.13%, more than twice the index move.
What sorted them was the AI trade splitting into two books.
Across the five sessions to Sep 15, CrowdStrike rose +15.5%, Palo Alto +11.3%, and Datadog and Fortinet +9.5% each. Over the same five sessions CoreWeave fell -18.9%, Lam Research -15.5% and Nebius -15.0%.
Software that sells AI went up. Hardware and compute that pays for AI went down. A sector index averages that away, which is why the S&P’s own return says so little this week.
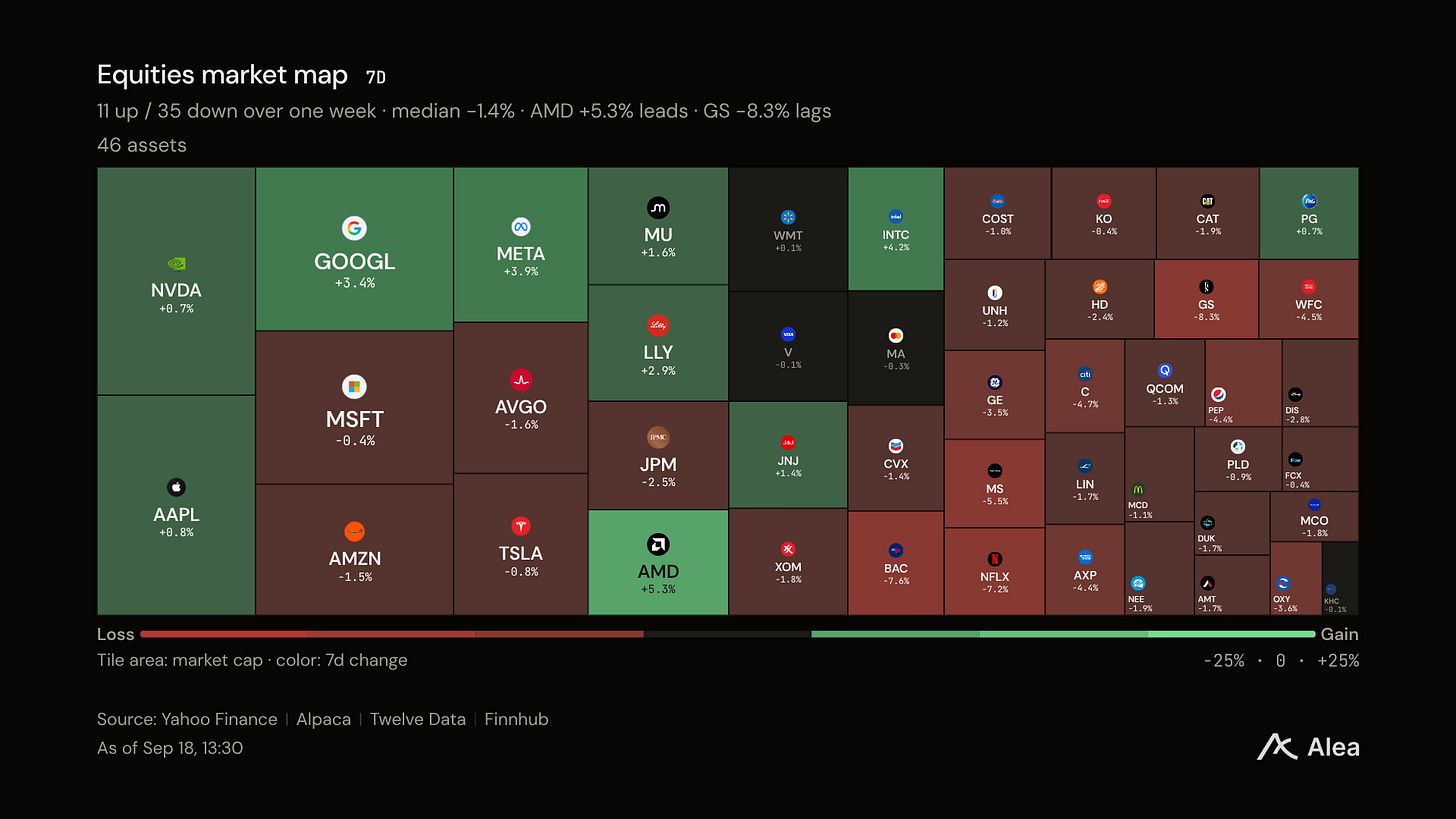
The rotation underneath was defensive. Health Care led at a +1.02% median with 44 of 59 members higher. Materials and Consumer Staples were the only other sectors with a positive median. Financials fell -2.31% and Energy fell -3.01%, the worst in the index.
Energy deserves a second look, because it called the oil move before the oil market did. Crude rose +1.86% through Thursday while energy equities finished last, with only 5 of 21 members higher. And that was the end of a run, not the start of one: crude gained +12.25% the week before and +13.56% over the month. Energy shares followed none of it. When the commodity runs for a month and the companies that sell it fall, the equity market is pricing the move as temporary. Friday’s -5.84% in crude settled the argument.
Commodities
The energy complex gave the week back; the rest of the board did not. WTI fell -4.09% to $95.96 and Brent -5.33% to $99.03, while copper rose +3.53%, natural gas +3.14% and gold +0.34% to $4,424.
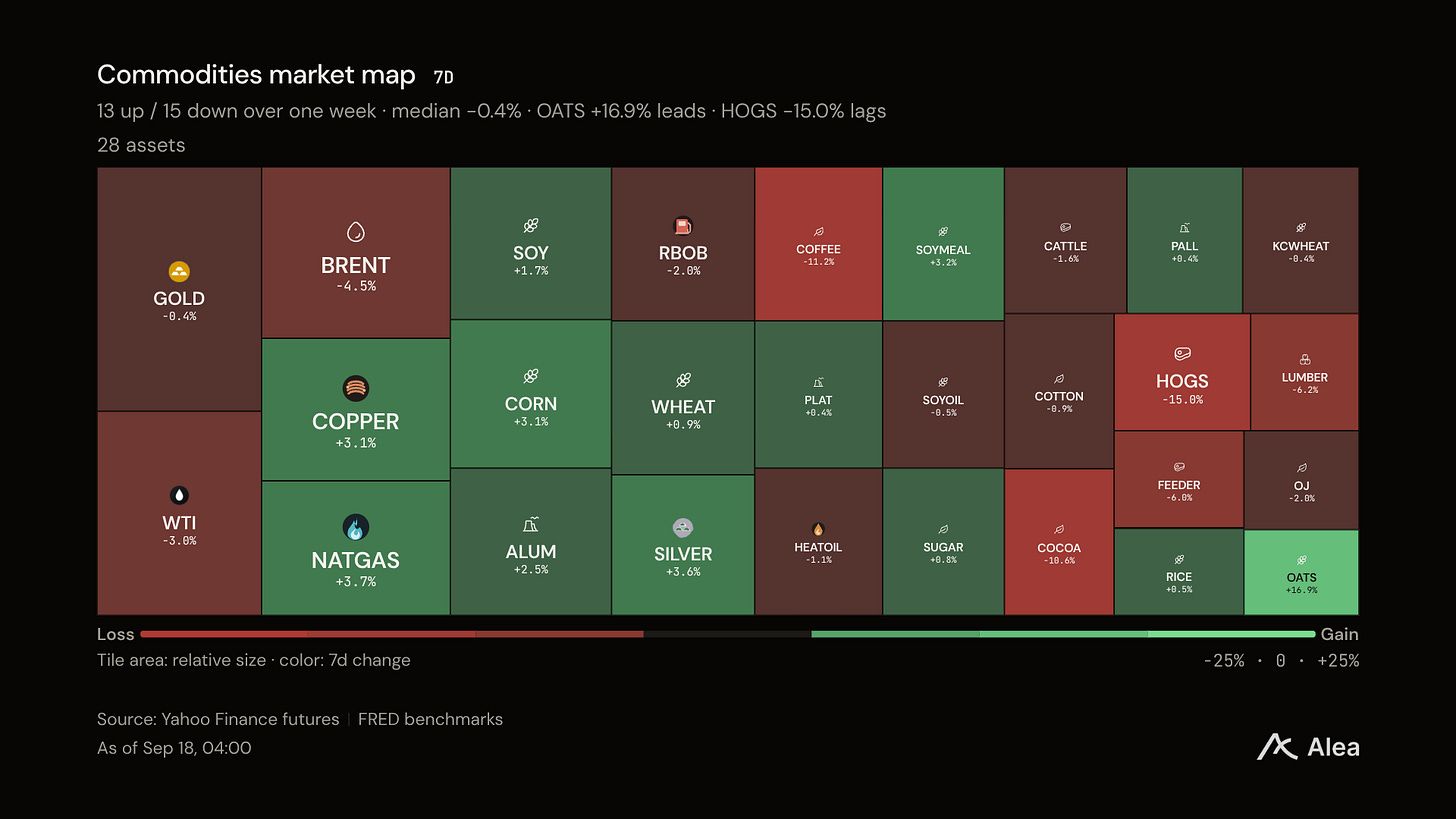
Crude carried a geopolitical premium that drains the moment nothing happens, and it drained: -9.4% from Monday’s $105.83. Refined products did not follow. US on-highway diesel reached $6.285 a gallon in the week to Sep 14, up 31.8 cents on the week and $2.546 over twelve months, a +68.1% annual rise. Regular gasoline reached $4.319, up $1.151 over the same twelve months. Diesel is rising at close to twice gasoline’s rate, into the season gasoline leaves and diesel enters.
One refinery explains part of it. ExxonMobil’s Joliet plant lost site power on Sep 13 and shut automatically. It runs 264,000 barrels a day, about 6% of Midwest capacity. A barrel makes two products and only one of them is short, which is why the crack held while the crude premium went.
Gold is the quiet result. A week that lifted the front-end real rate +8bps and the dollar +1.15% is a week gold usually loses. It finished +0.34% at $4,424 instead.
The Week Ahead
Next week is thin. New home sales land on Sep 24, durable goods orders and the Michigan consumer survey on Sep 25. None of them speaks to the question this week raised. The calendar turns on Sep 30 with Personal Income and Outlays, which carries the PCE price index, followed by the September employment report on Oct 2 and consumer prices on Oct 14.
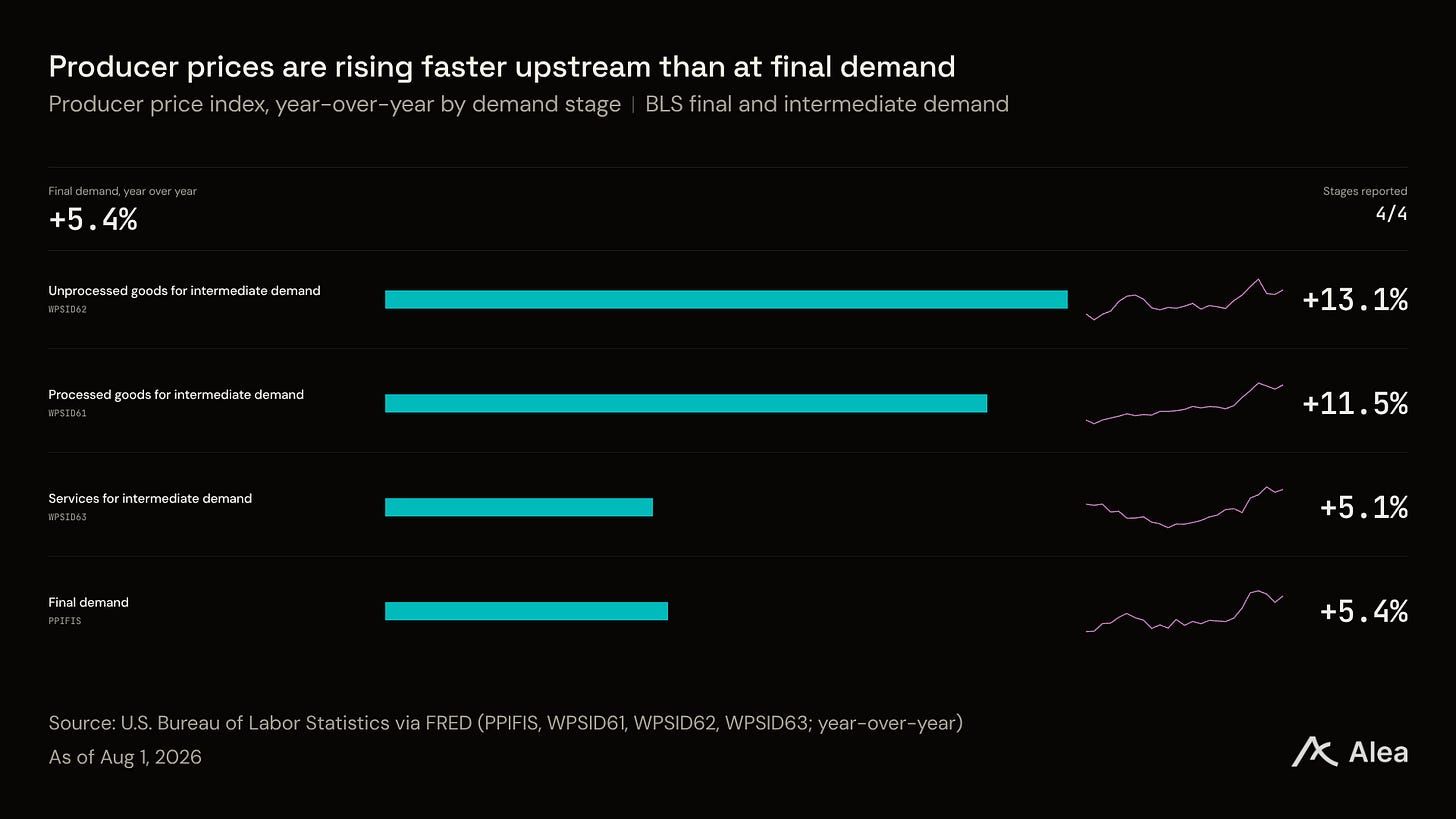
PCE on Sep 30 is the test, and the pipeline behind it is not calm. Producer prices for unprocessed goods at intermediate demand are running +13.1% year over year and processed goods +11.5%, against +5.4% at final demand. That gap is the margin question: either it compresses into profits or it passes into prices.
This week’s move says the market believes the Fed capped the pass-through from energy into inflation. A hot core PCE that leaves breakevens where they are confirms the read. One that lifts them breaks it.
Market Assessment
The bond market treated this rise as credible and priced it through expected inflation rather than through growth. Inflation compensation fell at every tenor, the curve flattened from the front, credit stayed calm, and volatility fell. Five percent on the ten-year arrived, lasted two sessions and left without a fight. The oil shock that set the inflation price a week ago no longer sets it, and a -9.4% unwind from Monday removed the shock itself.
The strongest competing explanation is that this is the first sign of a growth slowdown, with the long end rallying for the usual reason. The front end is the check, and it rose. If the two-year starts falling alongside breakevens, the interpretation changes from credibility to weakness, and credit spreads would confirm it before equities do. Nothing in this week’s credit prints leans that way yet.
Material uncertainty sits in one place. The five-year move is ordinary on its own. What was unusual was its pairing with rising crude, and by Friday the crude leg had gone, which removes the pairing rather than resolving it. A second rise in October now prices close to a coin flip at 45%; the next three weeks of data move that price.
Important Links
Personal Income and Outlays schedule, Bureau of Economic Analysis
Market data: Yahoo Finance, CoinGecko, Kalshi, Coinalyze, DefiLlama

Oil rose again and inflation compensation stopped following it. Pulse, Alea’s flagship report, took up that same pair on Sep 12 in “Higher rates, lower confidence”. It read the week as two squeezes at once, in fuel and in money. Pulse works through the economics behind a move, the explanations that compete with the obvious one, and the evidence that would change the view. Our new Pulse edition will follow on Sunday. In the meantime, read the latest Pulse.
Building a protocol? Give institutional readers a reason to keep following your work. Alea connects a researched investment case with a maintained data room, live analytics, and continuing intelligence. Readers can understand the business and track its progress. Explore our research and data rooms.