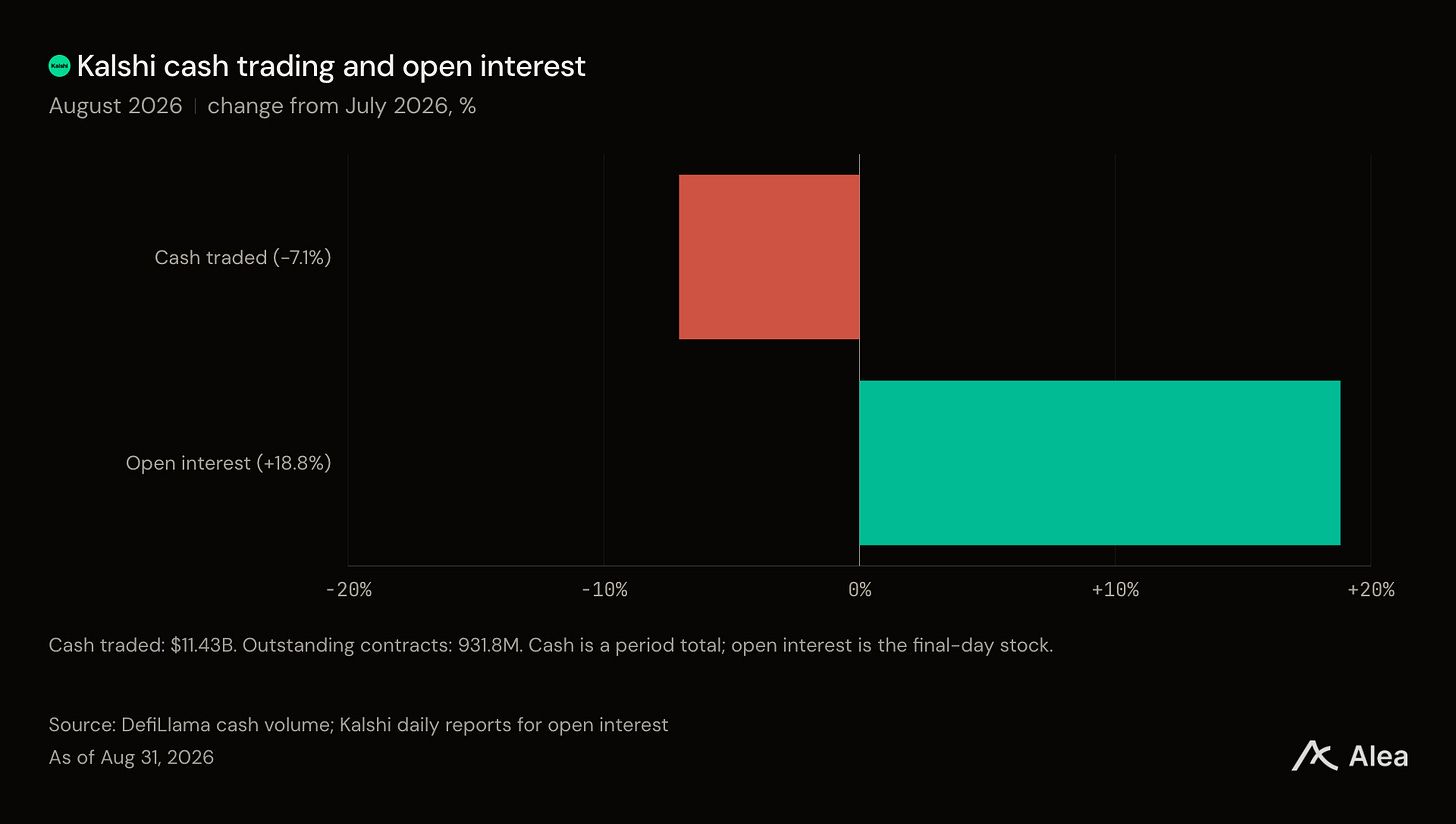
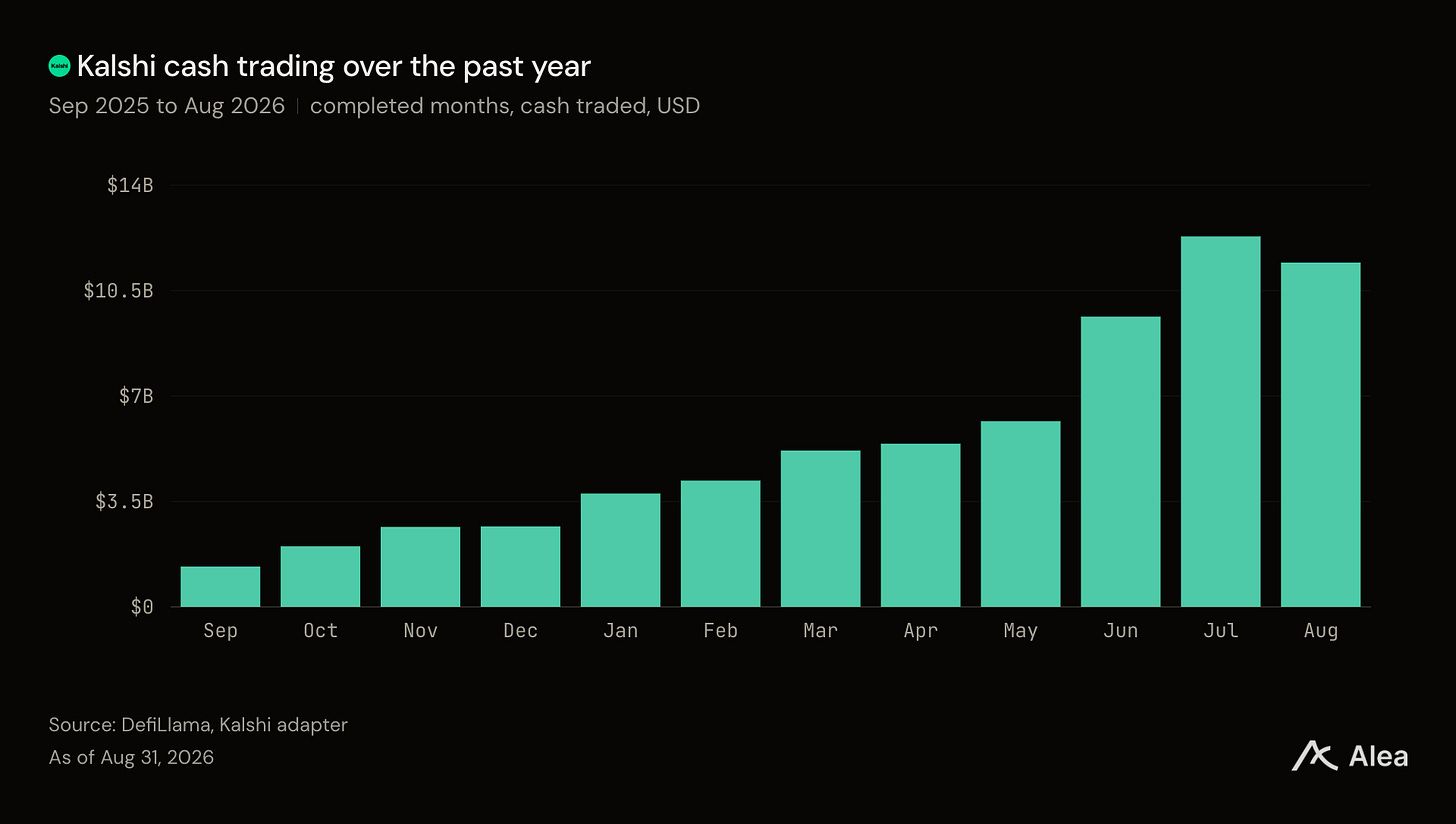
Kalshi’s event markets traded $11.43B in August (-7.1%), ending twelve monthly increases. But positions kept building: traders finished the month with 147.49M more open contracts (+18.8%). Where did those positions build? Elections, sports, and economics supplied nearly three-quarters of the increase. The 2028 Democratic nomination alone added 30.86M contracts.
Takeaways
August’s $11.43B in cash trading equaled 87% of the entire first quarter. The monthly decline followed July’s record $12.30B.
Contracts traded fell -2.5%, against -7.1% in cash turnover.
Combinations generated 44.2% of contract volume. Elections generated just 0.7%, but held 34.9% of open interest at month-end.
Trading in 13 tracked Kalshi perpetual futures reached $15.23B (+109.5%). BTC and ETH supplied 87.3%; those futures notionals stay separate from event-contract cash volume.
Economics open interest rose +129.2%. Fed-decision contracts accounted for 88% of the increase, ahead of September’s inflation releases and policy meeting.
An $11B month after July’s record
The $11.43B total was +18.6% above June and 30.8 times August 2025’s $370.77M. Year-to-date cash trading reached $58.11B. DefiLlama recorded just one larger month: July.
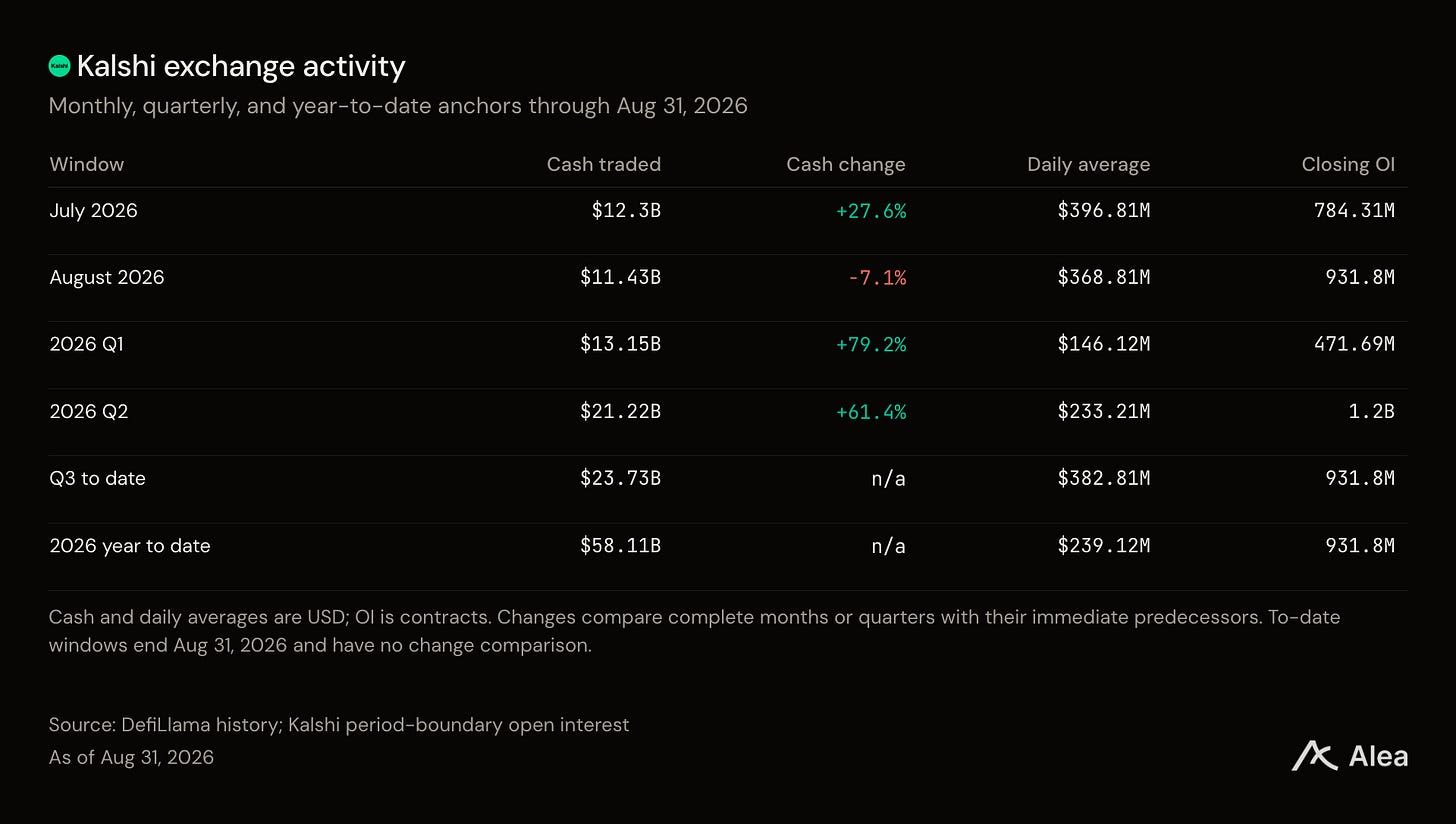
Matching July’s daily pace would require a +7.6% increase, to $396.81M a day.
Contracts traded fell from 41.05B to 40.03B, and cash paid per reported contract declined from 30.0 cents to 28.6 cents.
July also had the World Cup.
Market access narrowed in Washington, too. An August 12 court order required initial geofencing by August 19 for sports, elections, and several other topics. Specified economic categories were exempt, and exits from existing positions remained permitted.
The busiest products were not the largest positions
Combinations accounted for 44.2% of August contracts traded, followed by sports at 33.9% and crypto at 18.9%. Together, those groups generated 97.1% of activity. Cross-category combinations alone contributed 32.1% of venue volume.
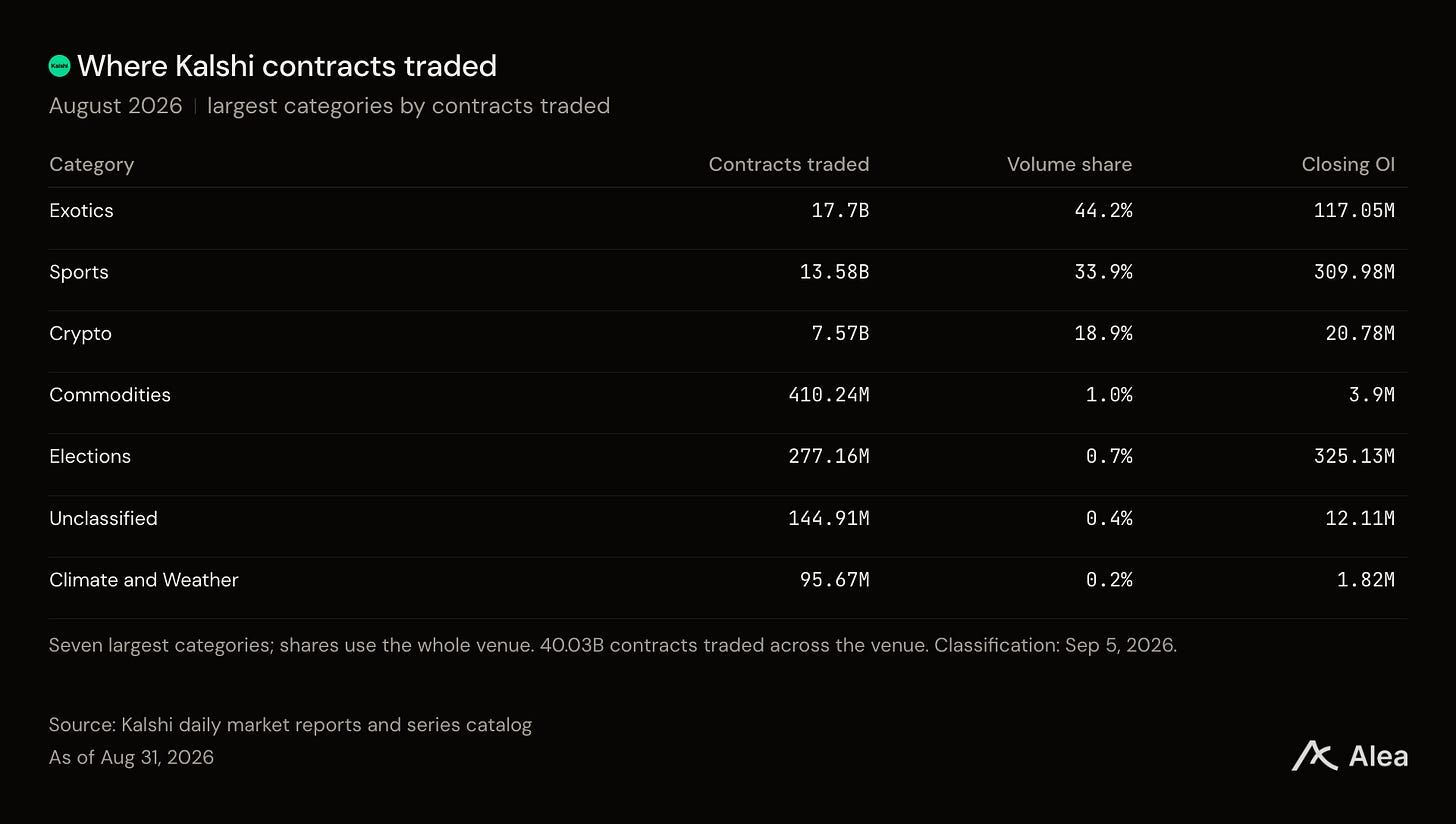
Elections added 48.00M outstanding contracts, sports 39.68M, and economics 21.93M. Those categories explain 74.3% of the exchange’s increase. Elections finished with 325.13M open contracts despite accounting for less than 1% of trading. A volume-only watchlist would underweight that part of Kalshi.
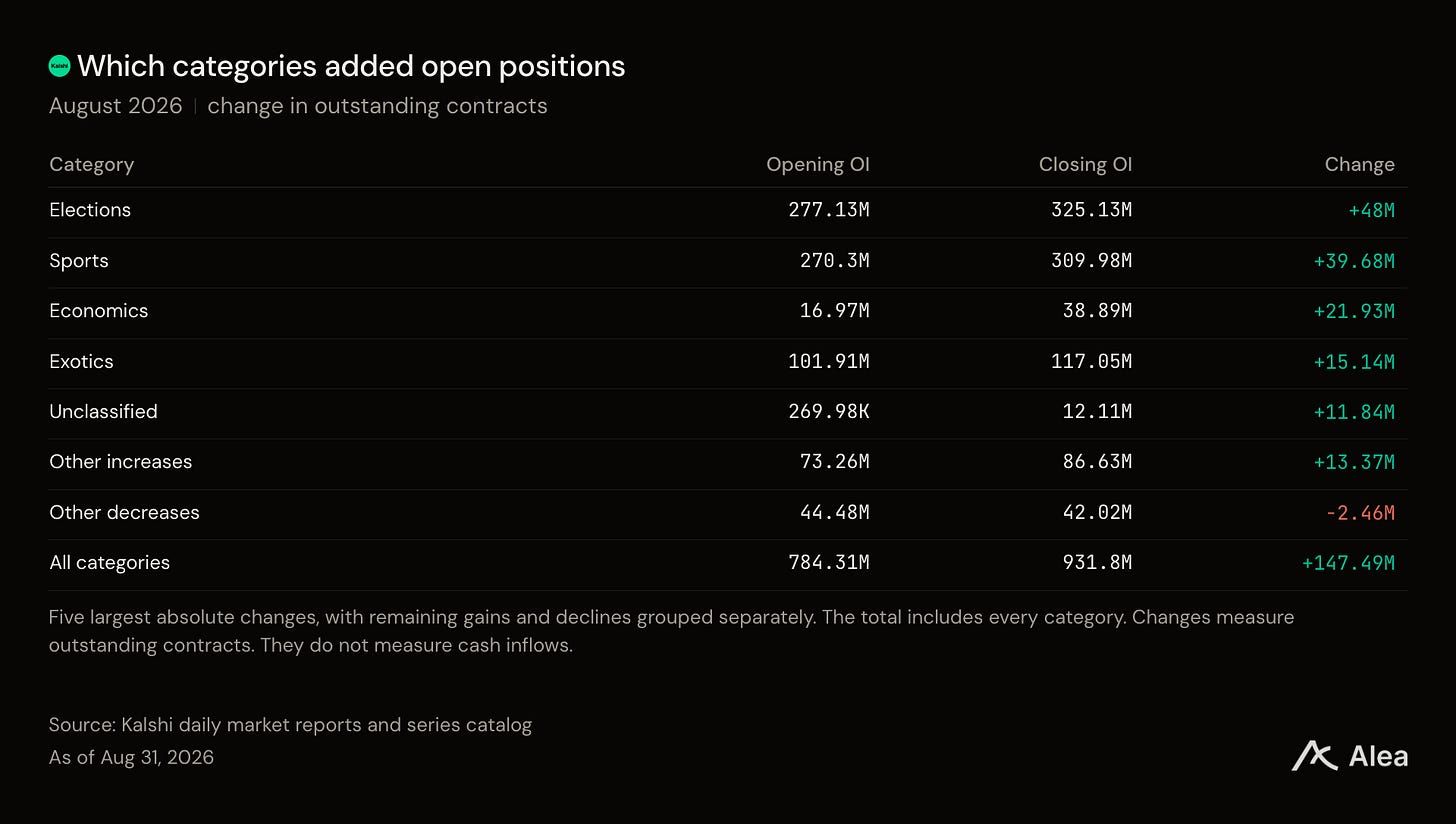
Within elections, the Democratic nomination series grew from 112.14M to 143.00M open contracts. That 30.86M increase explains 64.3% of the category’s growth.
The Fed attracted positions before September’s decision
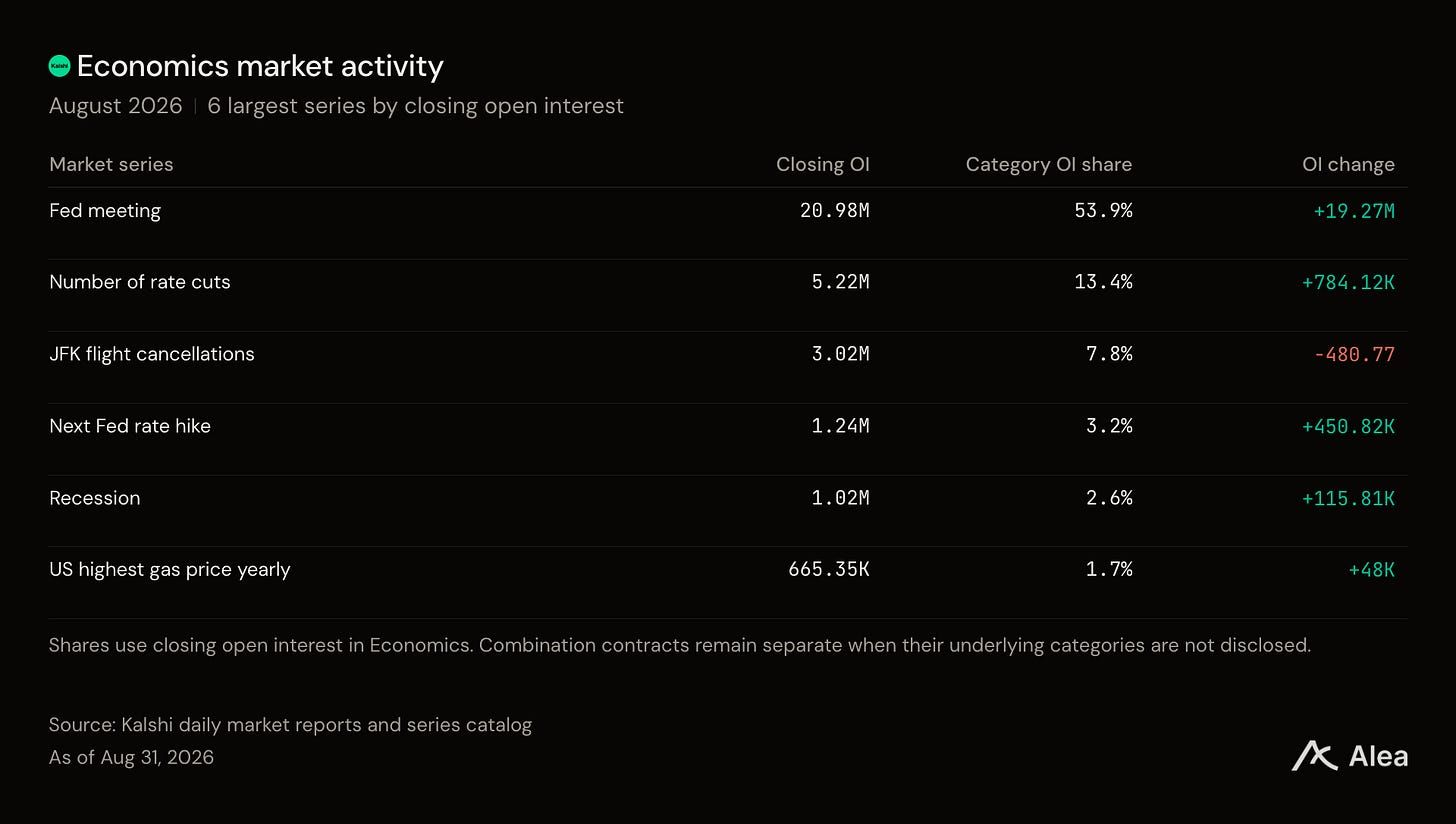
Economics open interest rose from 16.97M to 38.89M contracts (+129.2%). The Fed-decision series added 19.27M, accounting for 88% of that growth. It covers several meetings, so the entire increase cannot be assigned to September’s decision.
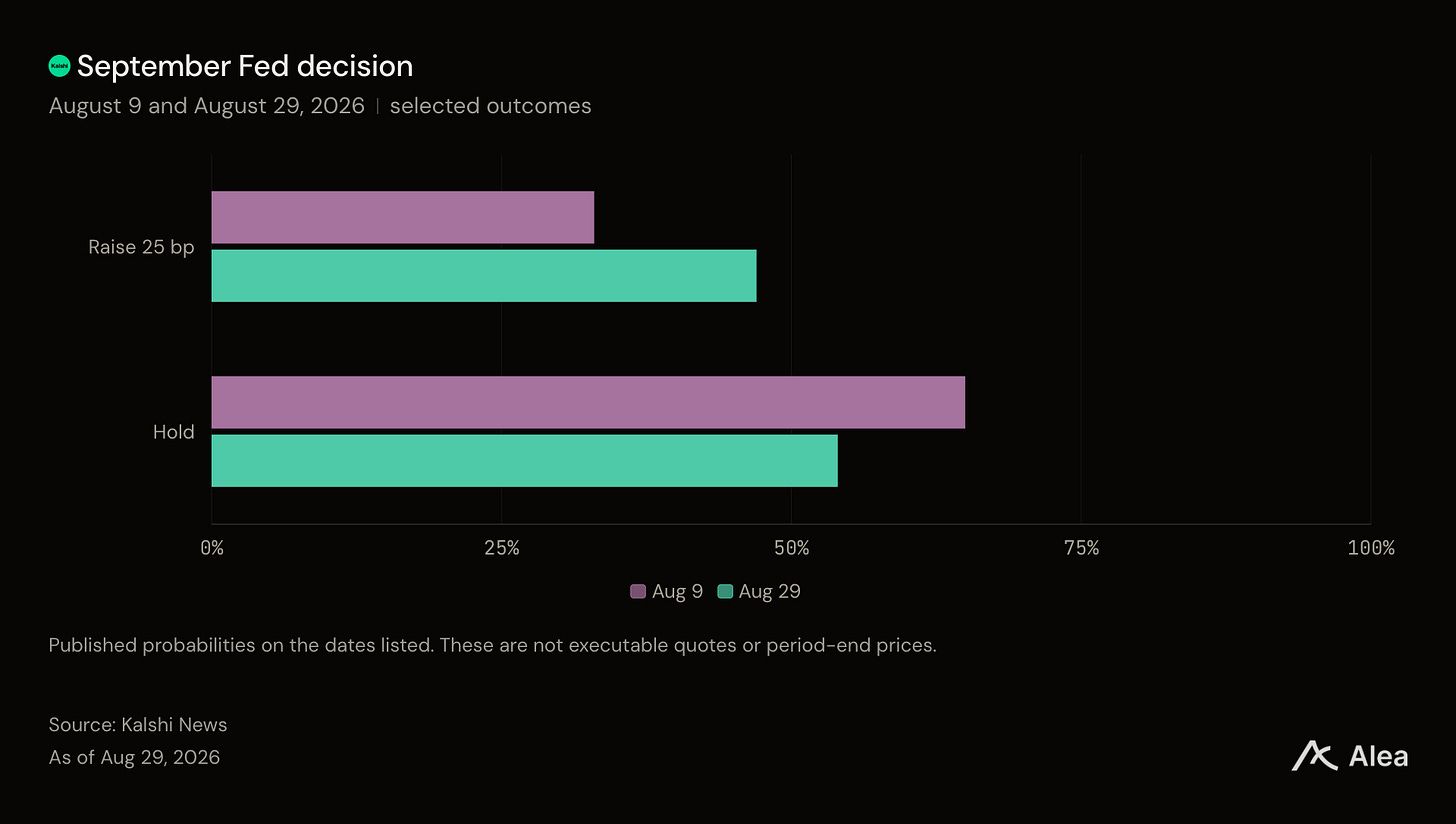
Before Kevin Warsh’s August 28 Jackson Hole speech, a September quarter-point hike traded near 30%. Kalshi reported 47% the following day. Warsh said annual PCE inflation was 3.7%, against the Fed’s 2% target, without committing to a September decision. Traders had a reason to reassess the risk of a hike.
Sports positions reflected different seasons
The PGA Tour series ended August with zero open interest, down 69.46M contracts. The Tour Championship ended August 30. Meanwhile, Super Bowl open interest increased 20.40M, World Series positions 16.29M, and the college football championship 9.24M. Expiring golf markets and football-season positions created large offsetting changes inside the sports total.
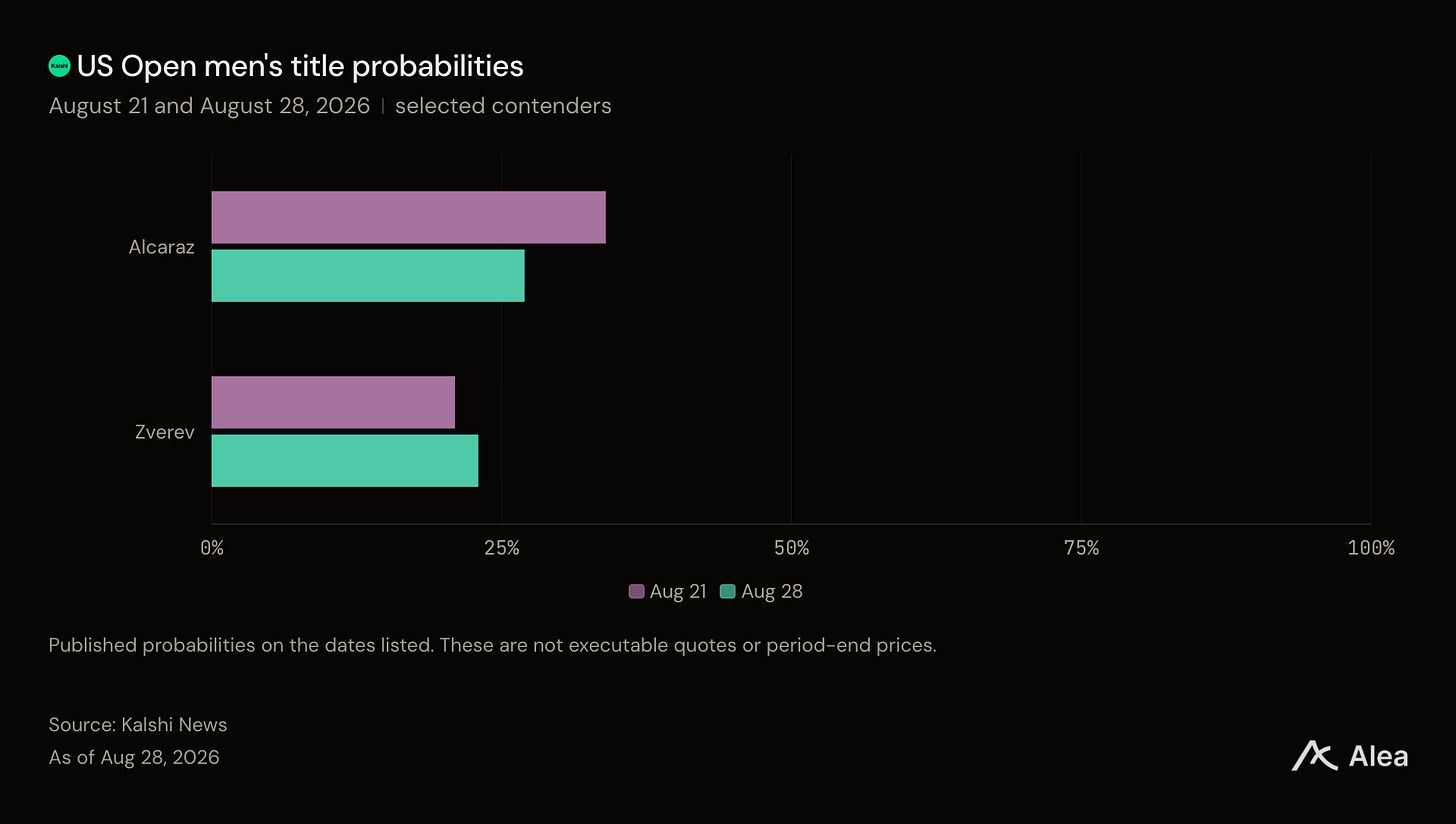
Tennis supplied a more immediate lesson in pricing. Alcaraz’s US Open title probability fell from 34% on August 21 to 27% on August 28. Sinner’s withdrawal removed a major rival. Kalshi reported that the draw put Djokovic and Medvedev in Alcaraz’s half. Alcaraz had not played a match since April. Zverev’s half contained no other Grand Slam winner. These details help assess the title odds, although the two checkpoints cannot isolate the draw’s effect.
Kalshi announced its US Open partnership on August 31. August ATP match volume totaled 1.52B contracts.
Crypto traders need to choose the price condition
Bitcoin’s 15-minute up-or-down series generated 5.51B contracts, or 72.7% of crypto volume.
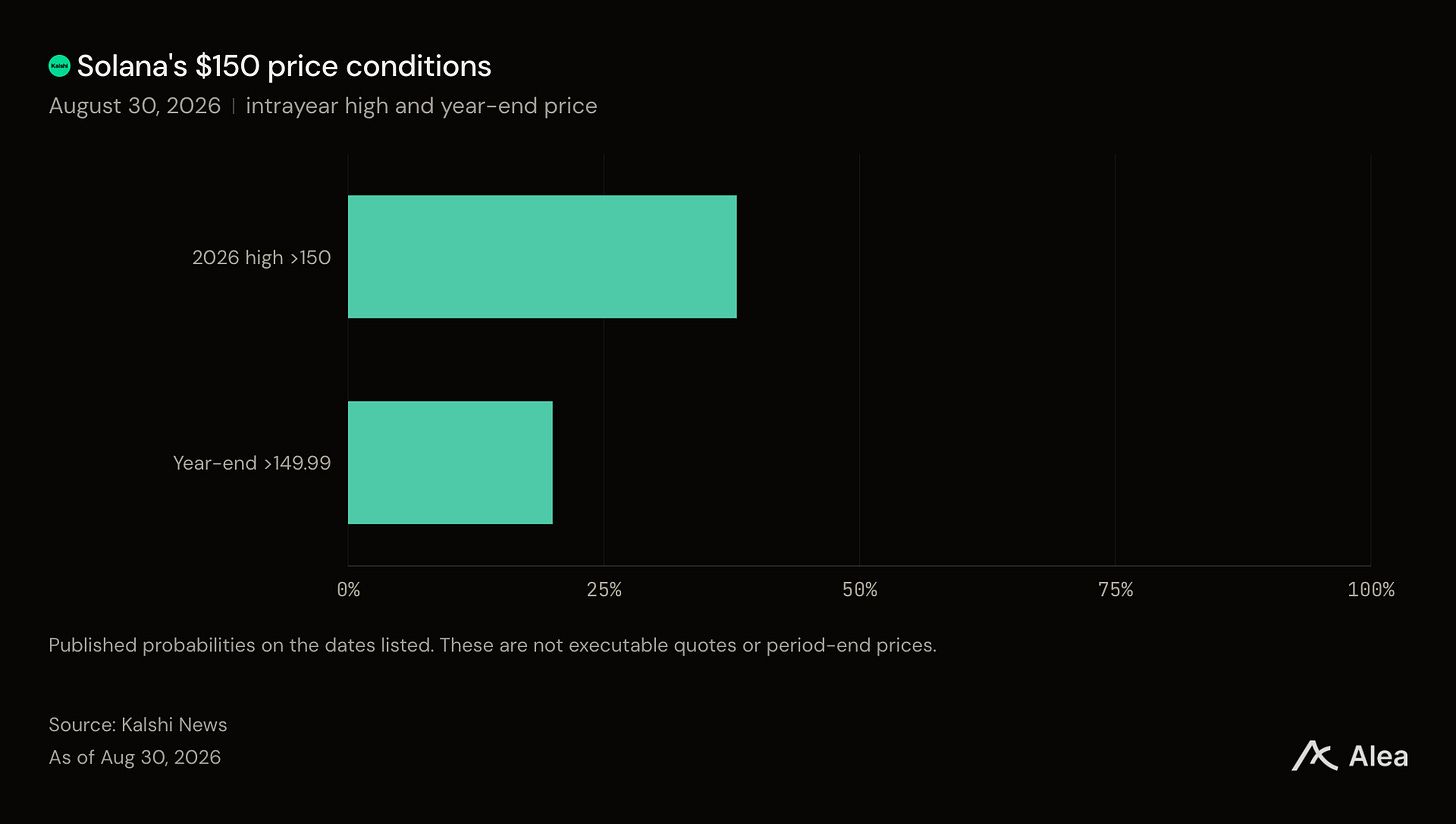
Take Solana as an example of how to use these markets to your advantage: SOL reaching more than $150 during 2026 was priced at 38%; the near-$150 year-end outcome stood at 20%. A rally followed by a reversal can satisfy the first condition and fail the second.
Perps grew while event trading slowed
Kalshi now also offers perpetual futures: leveraged contracts that track asset prices without a fixed expiry. Across 13 tracked contracts with complete July and August histories, notional volume reached $15.23B (+109.5%). BTC and ETH supplied 87.3% of that total.
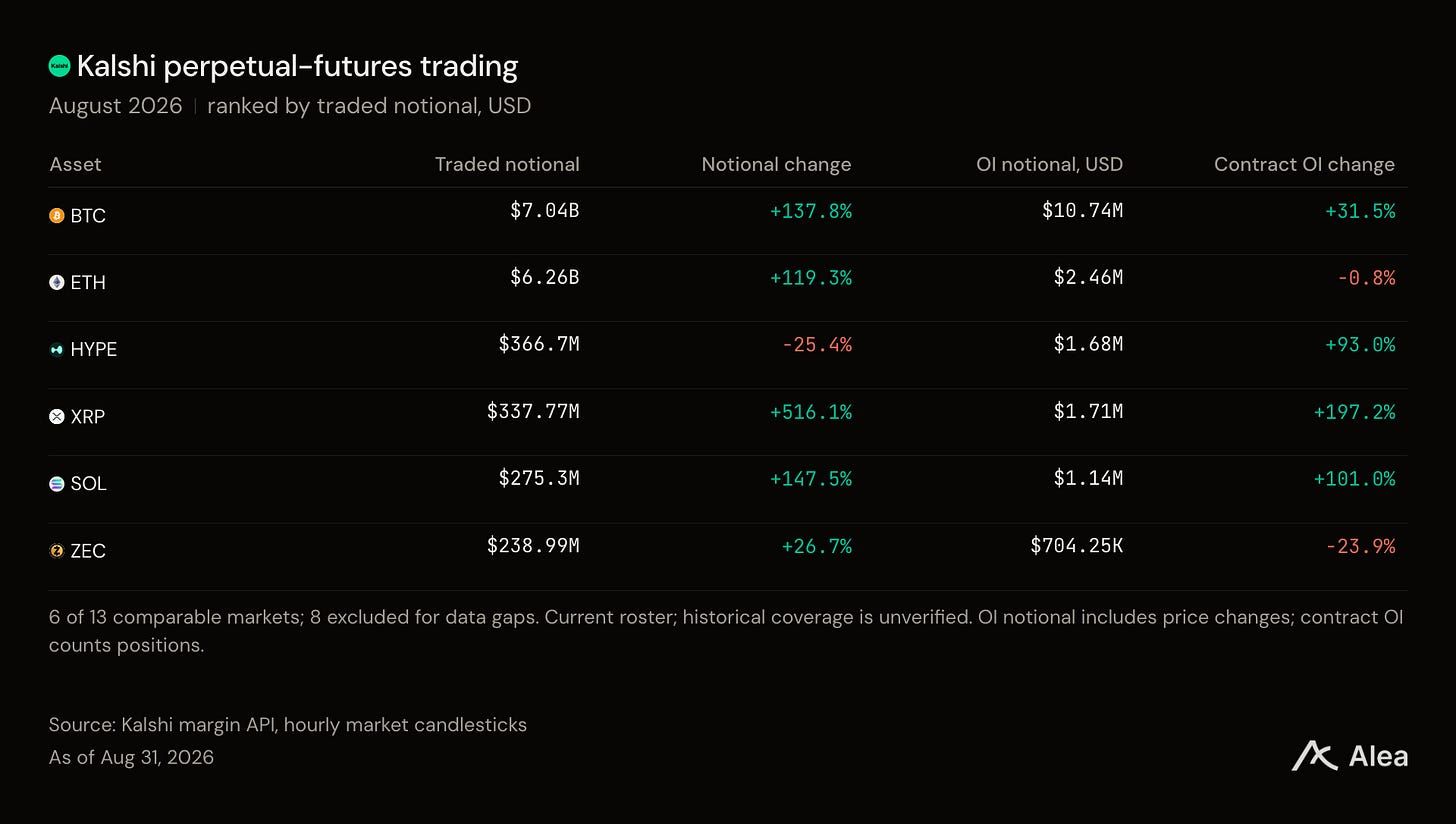
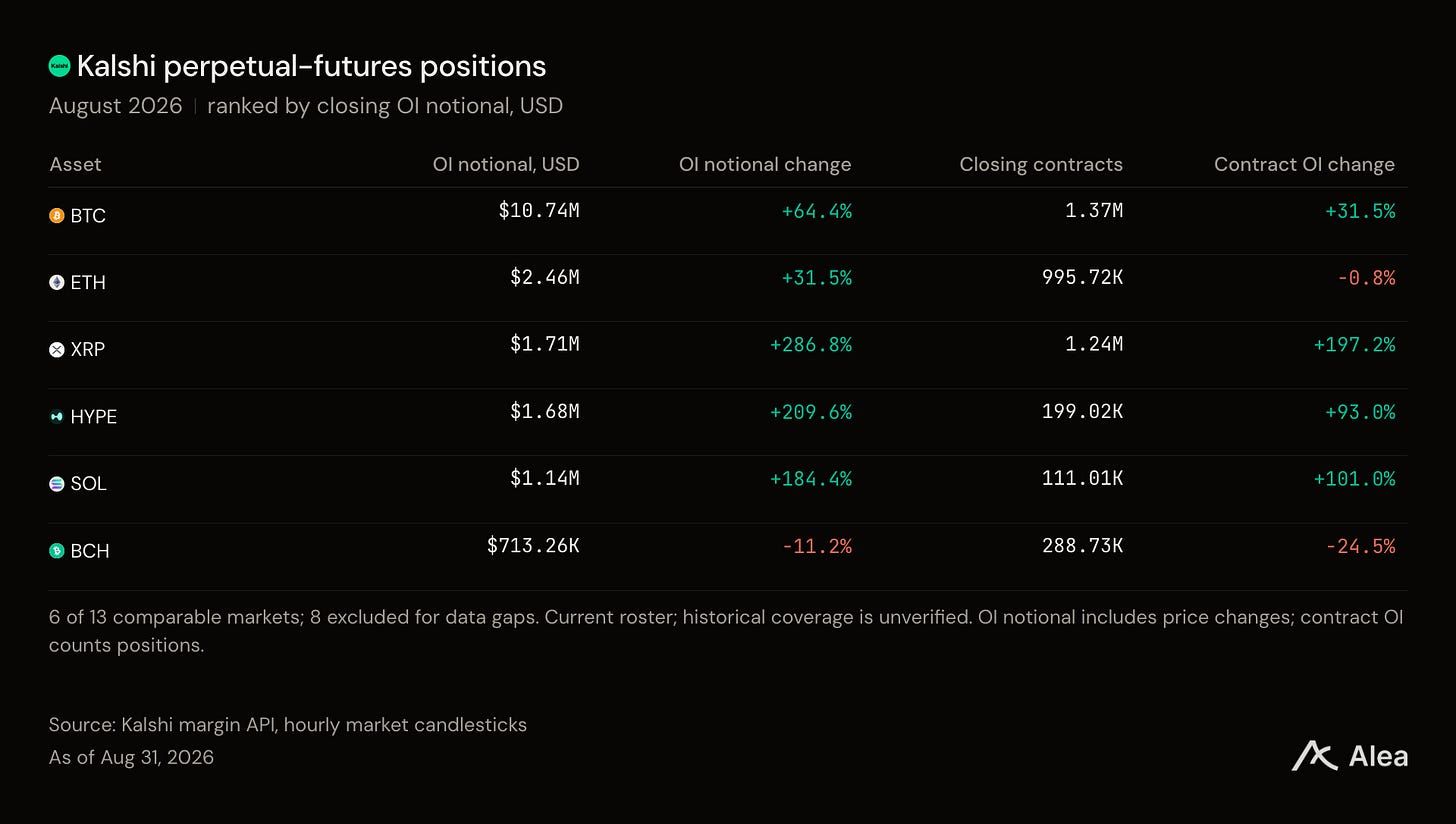
For ETH, the dollar measure of price exposure via open-interest increased +31.5% to $2.46M, while outstanding ETH contracts fell -0.8%. The contracts’ higher dollar value accounted for the increase. BTC had both: open-interest notional rose +64.4%, and outstanding contracts rose +31.5%.
Perps give continuous exposure to a price decline, with funding costs and liquidation risk.
Kalshi event contracts instead pay on specific price conditions and observation windows.
What to follow in September
The BLS published September dates for producer prices on September 10 and CPI on September 11. The Fed’s published calendar puts its next decision on September 16.
Follow the change in hike odds alongside positions in that exact meeting. Growth across all Fed contracts covers several different decisions.
Kalshi also published a study of how historical probabilities matched outcomes. Its headline results exclude Exotics, which generated 44.2% of August contract volume.
Evaluate calibration within a category and a consistent time before the event. The study supplies no August accuracy score for the combination products driving the most trading.
For September, start with two questions:
Does daily cash trading exceed August’s $368.81M average? September has one fewer day.
How much comes from combinations versus standalone football, elections, and economics contracts?
Track the total and its composition separately. August’s busiest trading products were far from its largest outstanding positions.
Important Links
Solana’s annual-high contract and year-end contract.

Read our Weekly Pulse, Alea’s full-week strategic synthesis across macro and the major liquid markets.
Help institutions understand your protocol. Alea brings research, data, and investor communications together so allocators can assess your business. Tell us about the institutional conversations you’re preparing for.