Friday Nov 20 joined Mar 12, 2020, as the only days since 2014 when the S&P 500, gold and BTC each fell 3% or more. Treasuries rallied instead: the 2-year Treasury yield fell 13 basis points on the day. The S&P 500 was already falling when Nvidia reported on Nov 17, and the selling built over the three days after. On Wednesday Nvidia closed at its lowest since Jun 24, 2025.
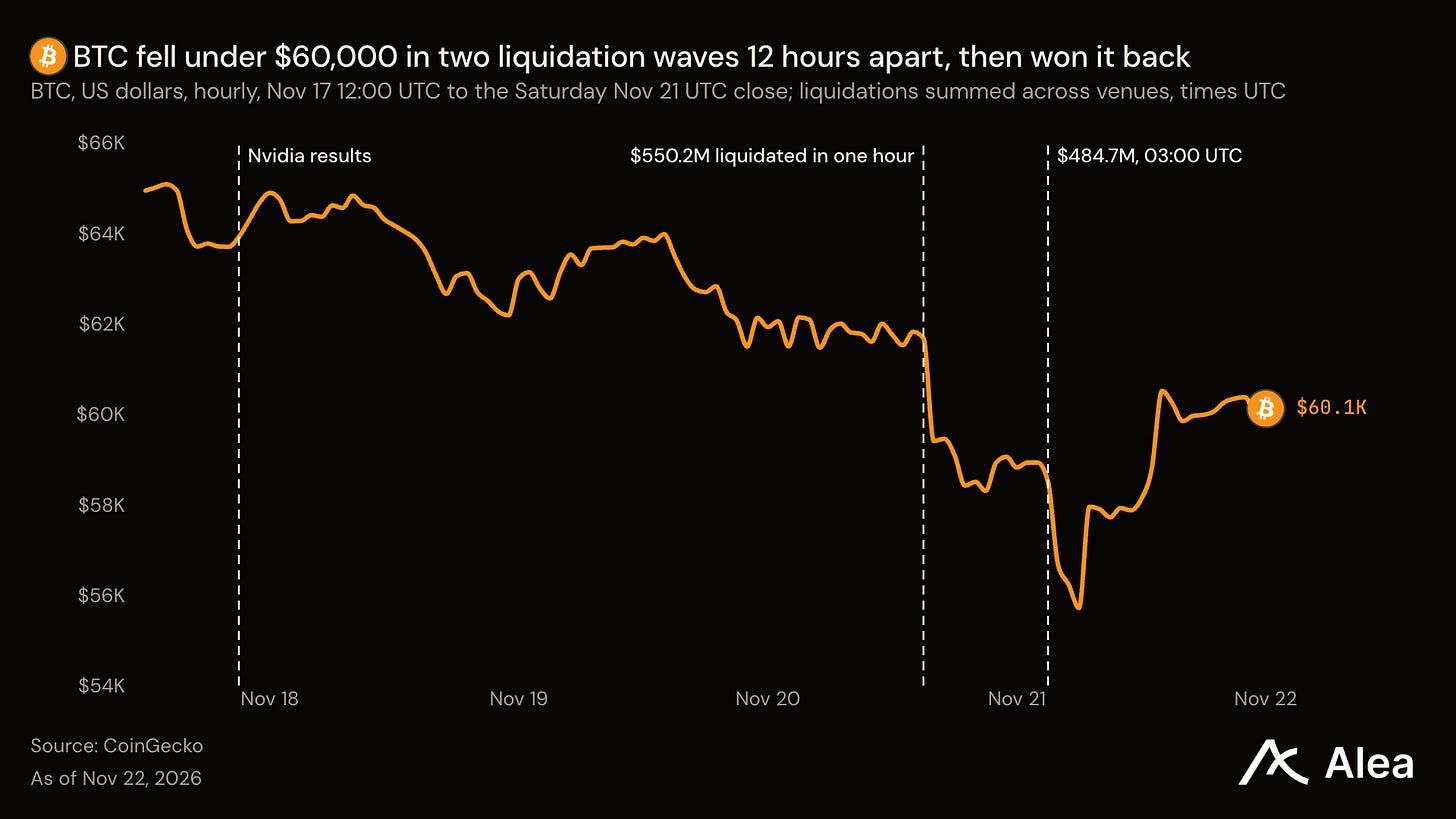
On Friday, crypto's first wave of forced selling came in the US morning, when exchanges liquidated $550.2M of leveraged perpetual futures positions in the 15:00 UTC hour. After a 19:11 UTC press report of an SEC review of Nvidia's accounting, NVDA lost a further 6.47% into the close. Exchanges liquidated $484.7M more in the second wave, at 03:00 UTC Saturday. By Saturday morning BTC had touched $55,130, its lowest since Sep 9, 2024. By the Saturday UTC close it was back at $60,216.
The largest stocks took the damage, led by the chip stocks, while the VIX closed Friday at 35.89, up from 19.30 a week earlier. The high-yield bond fund HYG lost 0.74% from the Monday open even as Treasuries rallied. A scramble for cash looks different. In the week to Mar 13, 2020, the 10-year real yield rose 61 basis points; this week it fell. Treasuries priced slower growth. Only in crypto do liquidations show the selling was forced.
Key Takeaways
Friday had one precedent since 2014. The selling built from Nvidia's Nov 17 results to a crypto liquidation wave in the US morning, a press report on Nvidia and a second wave before dawn on Saturday.
The biggest names carried the loss. On Friday the index fell more than twice as far as its median stock. Nvidia had its worst week since October 2008 on Friday closes. Equal weight now leads cap weight by a record margin this quarter.
Treasuries and staples drew buyers. Two-year and 10-year Treasury yields fell, while Walmart rose on a crash day. Gold fell anyway, while the dollar barely moved and the real yield fell.
Crypto's forced sellers hit in two waves, then the rebound squeezed the shorts. The second wave took total crypto market cap under its 300-week average for the first time, while open interest barely fell.
Next week shows whether the forced selling is done. Largest corporate BTC holder Strategy files its holdings on Nov 23; Dell reports on Nov 24. GDP, spending and claims print on Nov 25. MSCI drops Strategy at the Nov 30 close; the Fed decides on Dec 9.
Every section, ticker note and level table is in the full edition: Alea Pulse, Nov 21.
Macro: Bonds Took the Other Side of the Sell-Off
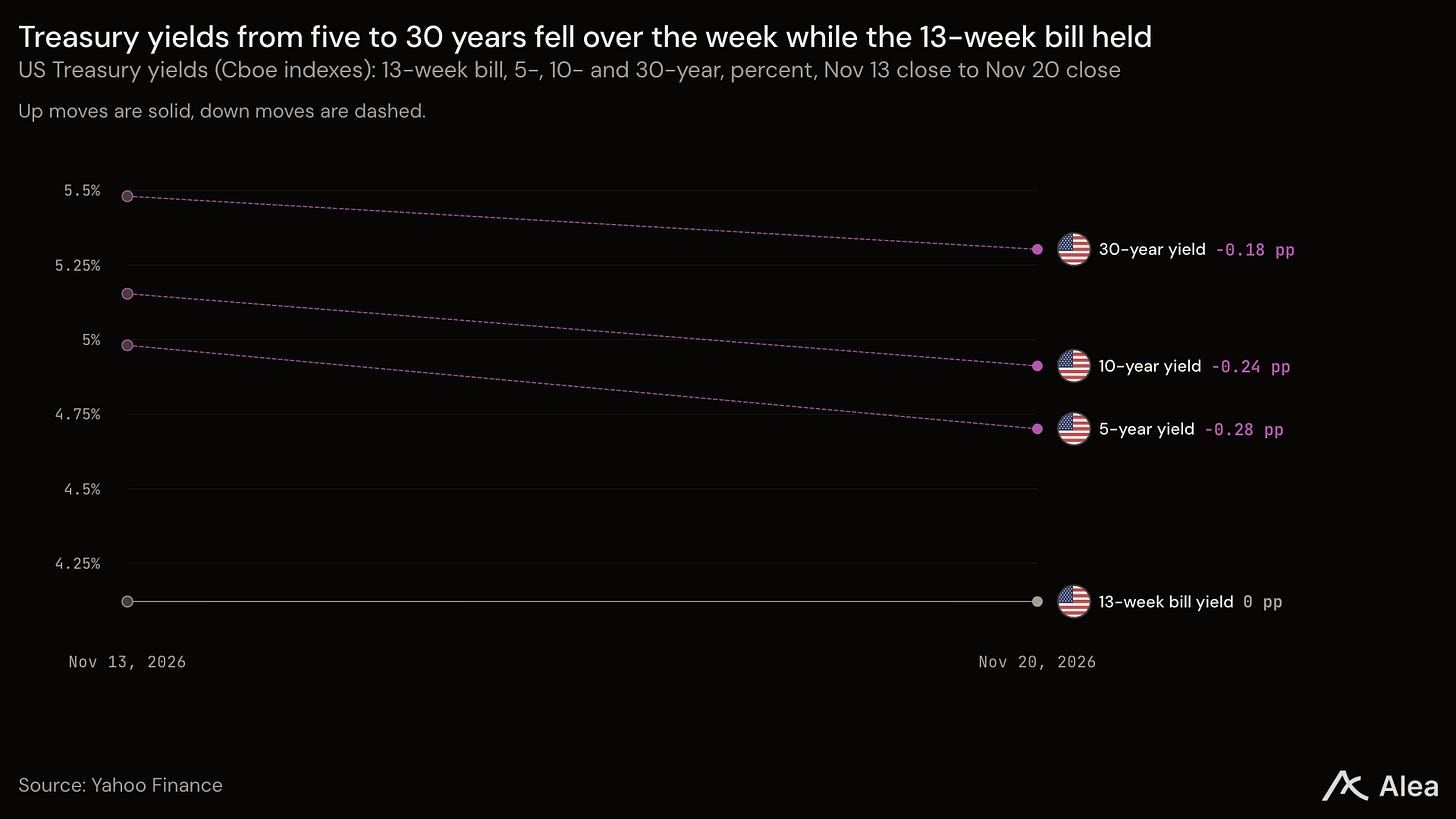
The 2-year Treasury yield fell 25 basis points over the week to 4.63%, its largest weekly drop since September 2024. The 3-month bill yield ended the week where it began, at 4.32%. Bond buyers still priced December's rate hike but dropped part of the later increases as stocks, gold and BTC fell together.
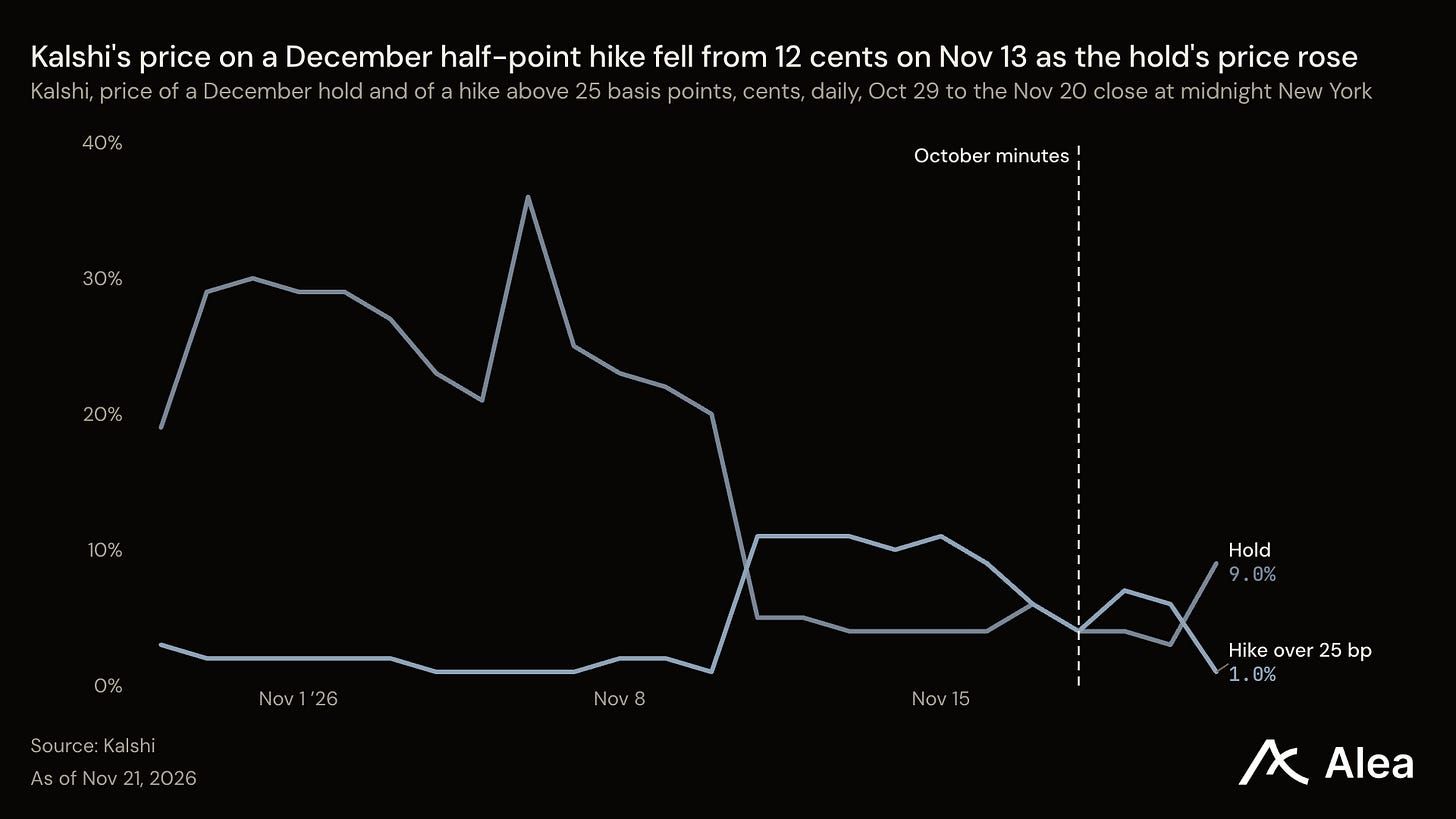
Kalshi's price on a December half-point hike fell from 12 cents on Nov 13 to 2 cents at Friday's close, while a quarter-point hike traded at 89 cents. Further out, fed funds futures price an average 4.45% for June 2027, down from 4.69% a week earlier. That's about two quarter-point increases above the current rate, where a week ago they priced three. Officials lean the other way. Governor Cook warned in Santiago on Friday that waiting longer to raise rates "risks getting behind the curve."
Treasury auctions $183B of two-, five- and seven-year notes from Monday to Wednesday, the first auctions since Friday's rally. October income and outlays post on Wednesday beside the second Q3 GDP estimate, durable goods and jobless claims. The November jobs report lands on Dec 4, five days before the Fed decides.
Thursday's auction of 10-year TIPS cleared at 2.903%, the highest real yield at a 10-year TIPS auction since July 2002. TIPS are inflation-indexed Treasury bonds; the real yield is what they pay after inflation. The nominal 10-year yield dropped 23 basis points over the week, and the real yield supplied 14 of those basis points and expected inflation 9.
Households cut their year-ahead inflation expectation by a full percentage point, to 3.7%, in the University of Michigan's final November survey. Interviews closed on Nov 16, before Nvidia's results. The Philadelphia Fed's new orders index slipped to -0.4 for a fourth straight decline. Initial jobless claims stayed low, at 203,000 in the week to Nov 14. Demand softened and households expected less inflation before the crash began, which gives the bond rally data to stand on.
Crypto: Two Waves of Forced Selling, Then a Short Squeeze
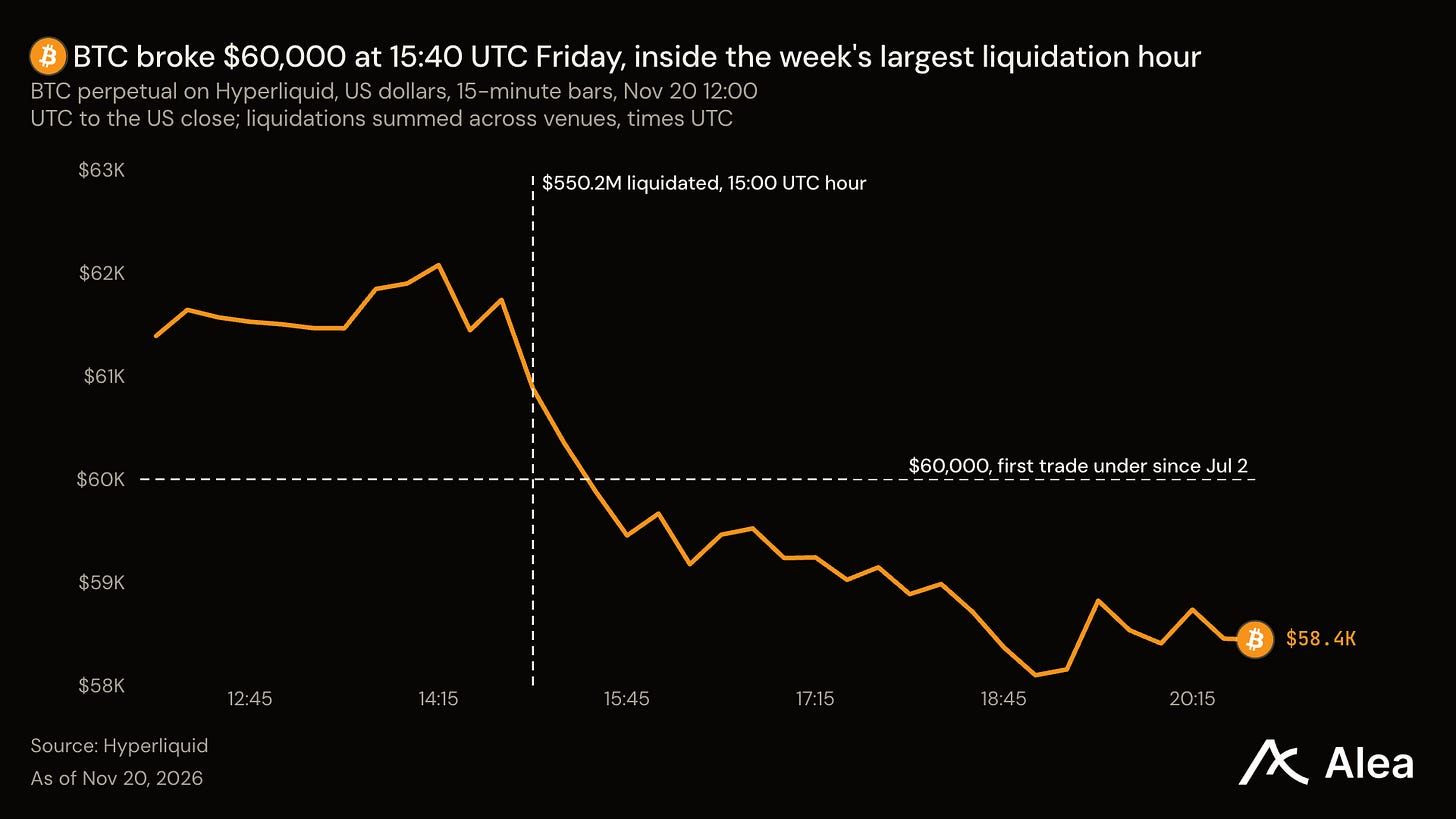
Exchanges liquidated leveraged crypto positions in two waves 12 hours apart. The first wave hit in the 15:00 UTC hour on Friday, the largest liquidation hour of the week, and nearly all of the positions it closed were longs. A perpetual is a futures contract with no expiry date. BTC broke $60,000 inside that hour, for the first time since Jul 2. Friday's total of $1.89B made it the second-largest liquidation day in 90 days. Thursday's selling wasn't forced, though. Holders pulled $582.3M from US spot BTC funds that day, their largest outflow since Oct 30.
The second wave hit before dawn on Saturday, with $484.7M liquidated in the 03:00 UTC hour, after which BTC slid for three more hours until it touched its low on Binance. At that low, total crypto market cap stood at $1.93T. Its 300-week average was $2.11T, while the 2022 bear market came no closer than 10.3% above that average.
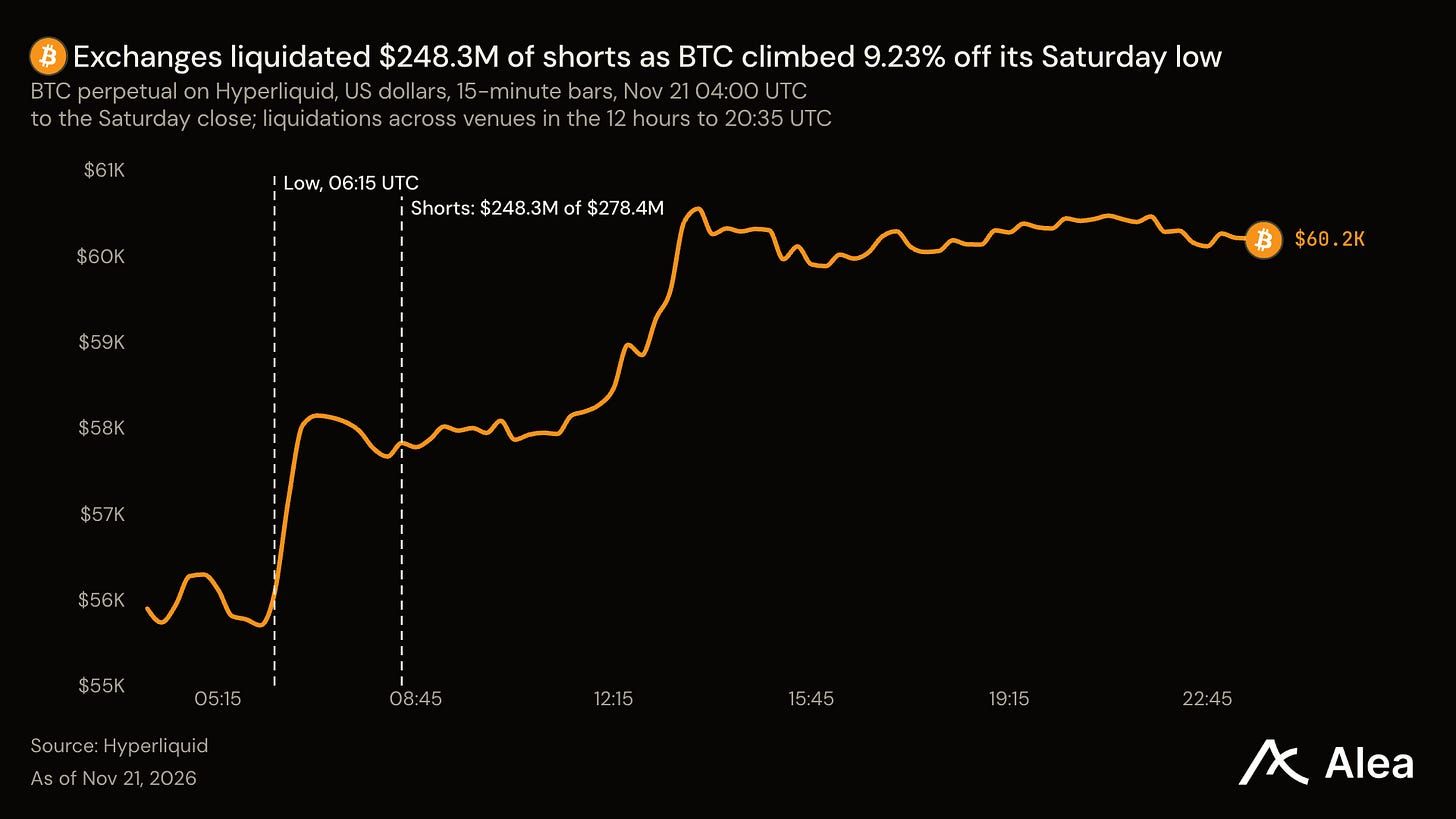
Open interest counts the futures positions still open. On Binance, Bybit and OKX, BTC open interest stayed flat in coins from Friday afternoon to the hour before the low, which means new positions opened as fast as liquidations closed old ones. Funding is the payment that keeps a perpetual near the spot price; when it turns negative, shorts pay longs. BTC funding on Hyperliquid read -11.78% a year on Saturday evening. Shorts made up nearly nine in ten liquidated dollars in the 12 hours to 20:35 UTC Saturday, while coin open interest fell 3.8%. A short that gets liquidated has to buy. BTC ended the UTC day up 9.23% from its low.
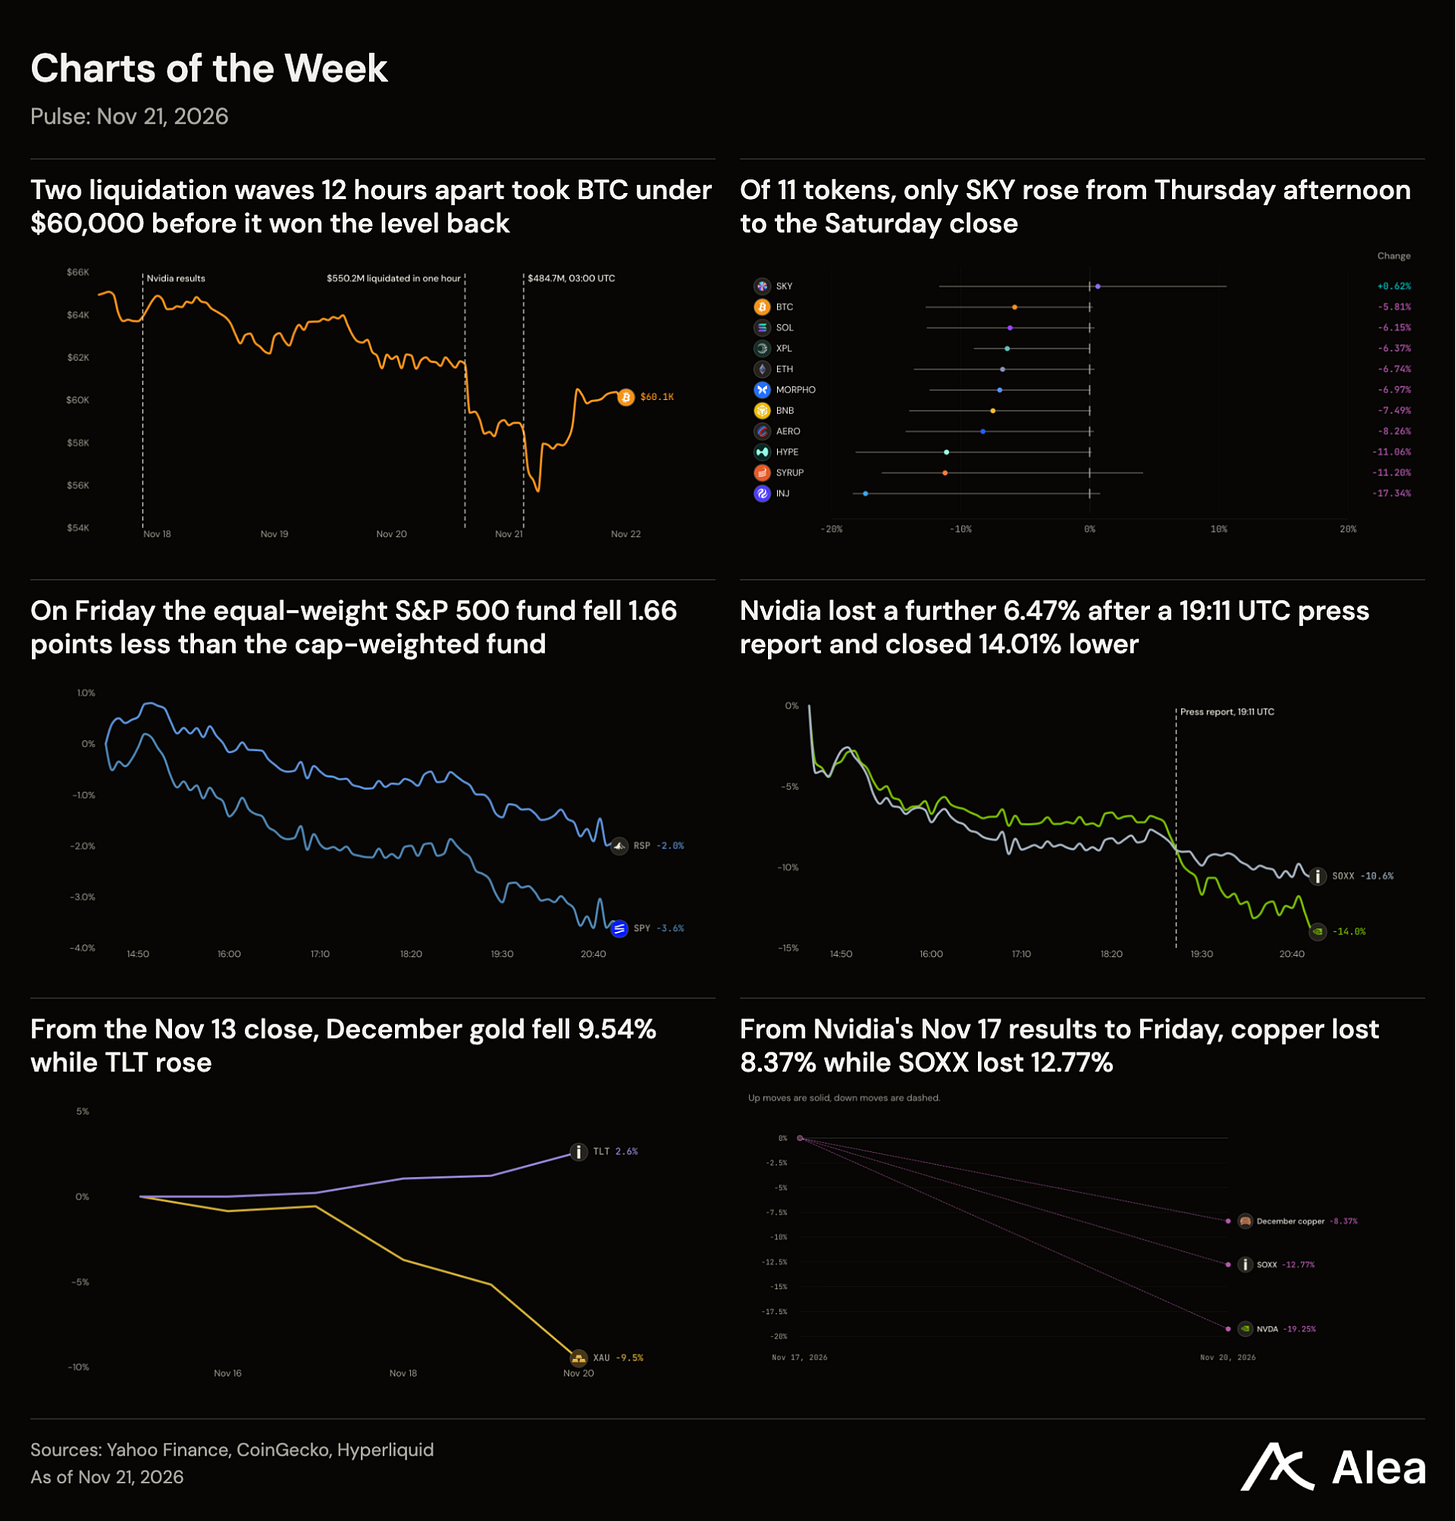
From 13:00 UTC Thursday to 07:00 UTC Saturday, the median large token fell further than BTC. SKY was the only one of 123 large tokens to rise, though it had already lost 12.7% earlier on Thursday. Over the same days the supply of Sky's USDS stablecoin on Ethereum shrank by $2.14B.
Saturday's fall measured 11.6% from the prior 24-hour high. BTC has fallen that far 53 times since 2018. In 26 of those falls, BTC closed higher a week later. In 39, it traded under that day's low within a month. A retest of the low inside a month is the usual path, the one BTC took in three of every four cases.
Equities: The Index Fell Twice as Far as Its Median Stock
On Friday the S&P 500 fell to its lowest close since Apr 13, its seventh straight loss and its longest losing run since February 2020. Friday's selling started in Taipei, where the benchmark closed 6.23% lower. It then ran through the largest US stocks until the bell, as Nvidia lost 14.01% and the chip fund SOXX 10.55%.
On Friday 374 of 499 S&P 500 companies fell, yet the median stock lost only 1.54%, less than half the index's 3.70%, because weighting by market value put the loss on the heaviest members. The equal-weight fund fell 1.66 percentage points less than the cap-weighted fund, the widest lead since 2003 on any day the cap-weighted fund lost 3% or more.
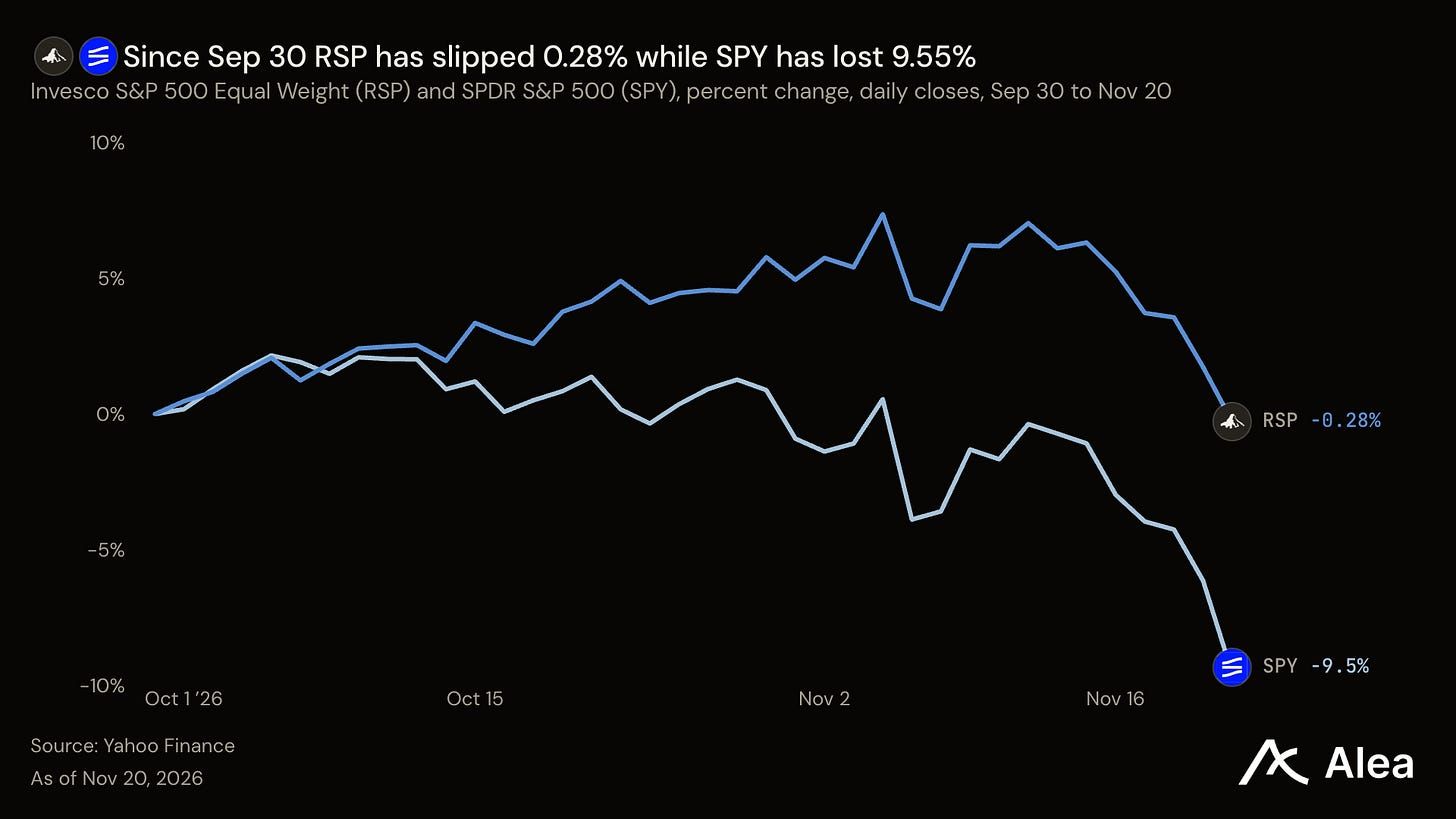
The equal-weight S&P 500 fund leads the cap-weighted fund by 9.27 percentage points this quarter, the widest lead in any quarter since it began trading in 2003. Since Sep 30 the equal-weight fund is down 0.28%, against a 9.55% fall for the cap-weighted fund. A holder of the average member has had a flat quarter; a holder of the index paid for its concentration.
Nvidia's 22.92% fall over the five sessions to Friday was its worst week since the week to Oct 10, 2008. Friday's loss came in two steps: a minute before the press report the stock stood 8.06% under Thursday's close, and the rest came after it. Neither Nvidia nor the SEC has confirmed a review. Friday's drop came three days after Nvidia posted $115.8B of quarterly revenue, 7.2% above the midpoint of its own guide. About three quarters of the week's fall came before Friday's press report.
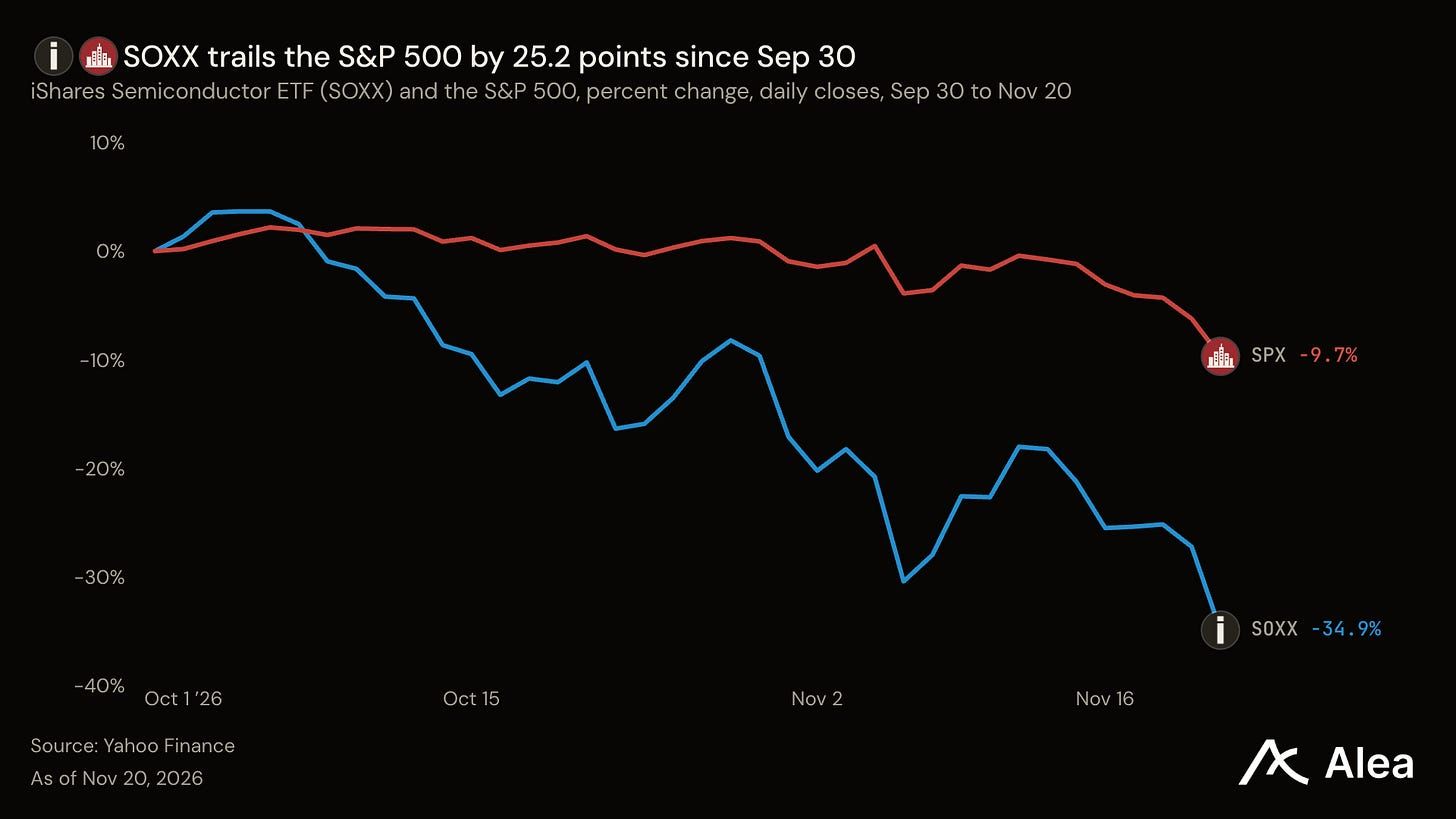
SOXX trails the S&P 500 by 25.2 percentage points this quarter, the widest shortfall of any quarter since 2001. The fund fell 17.35% in five sessions, its worst week since September 2001. In all five earlier quarters since 2001 with a SOXX fall of 20% or more, the S&P 500 lost 8.8% or more. Friday pushed the index's quarter loss past 8.8%.
Walmart and the consumer staples fund XLP rose together on Friday, the first time in 60 S&P 500 falls of 3.5% or more since 2000. Walmart gained 1.52% the day after its results and XLP 0.67%. The next down day shows whether that bid lasts.
Read the full Equities section
Commodities: Gold Fell with the Stocks It Was Meant to Hedge
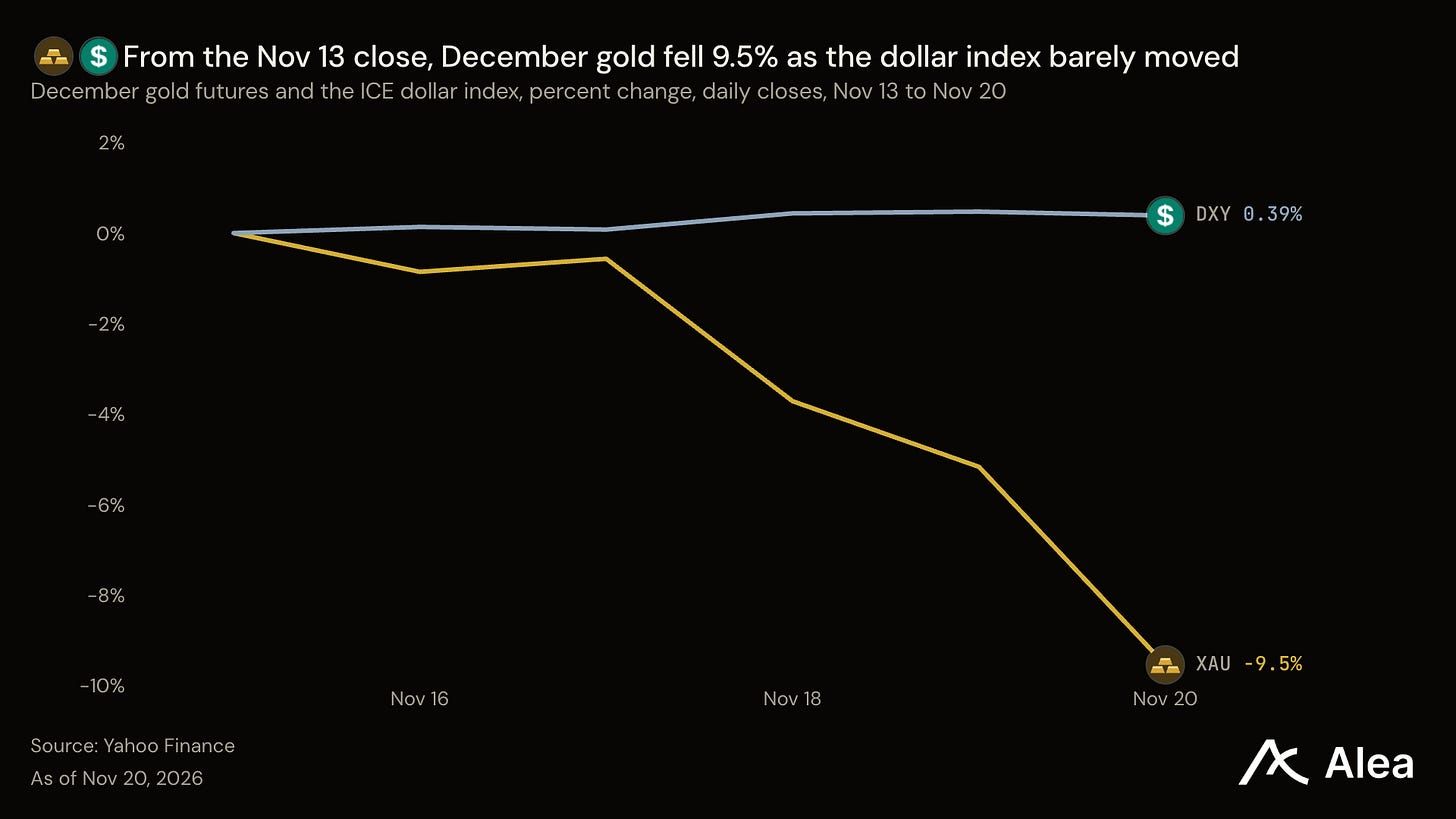
December gold lost 4.62% on Friday, its largest daily fall since Mar 19. Lower Treasury yields and a dollar that barely moved didn't stop it, while crude and natural gas rose.
The dollar index rose only 0.39% over the week, a move that accounts for about a 0.7% fall in gold. Gold lost 9.54% from the Nov 13 close, about 14 times what the dollar explains. Real yields argue the other way: the 10-year real yield fell to 2.77% over the week, which cuts the income a gold holder gives up. Gold has sold like this in a crash before. In the week to Mar 13, 2020, front-month gold fell 9.28% as stocks and BTC collapsed.
Money managers came into the crash light. On Nov 17 they held 102,942 net long gold contracts, the fewest since May 26. A net long is the futures bet on higher prices left after shorts are netted out. In silver they held a net long of just 1,280 contracts, the fewest since February 2024, yet silver still fell 16.4% from the Nov 13 close.
Copper had its worst session of the week on Wednesday, the day after Nvidia's results. The front-month contract fell 5.3% on Nov 18, its largest one-day drop since Jul 31, 2025. Copper reaches the AI trade through the grid. From Nvidia's Nov 17 results to Friday's close, December copper lost 8.37%, while SOXX lost 12.77%. Silver feeds no data center, yet it lost 7.41% on Friday alone. A broad metals sell-off remains the rival reading.
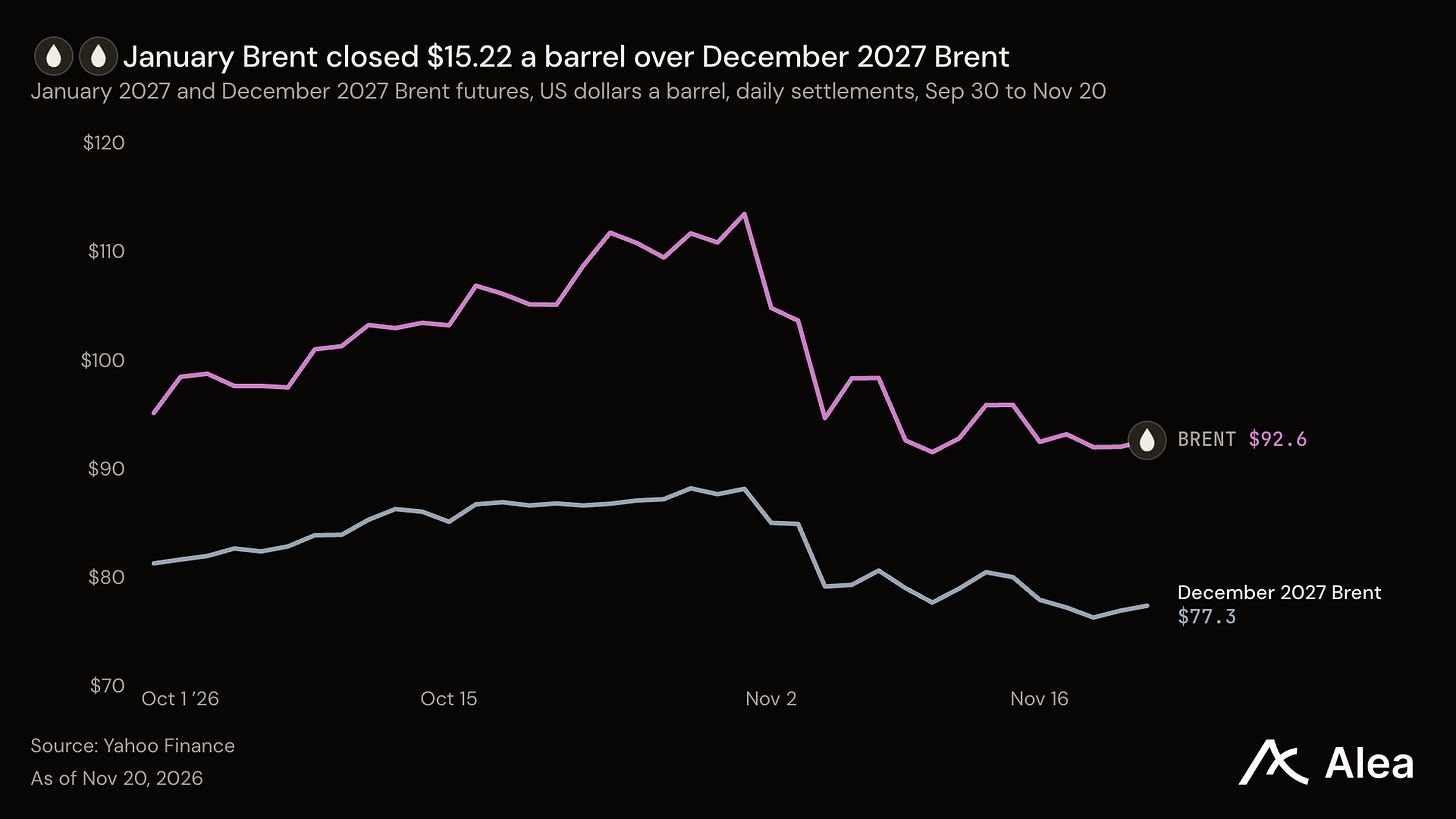
Natural gas and crude rose on Friday, the day gold fell most. Gas ended the week 6.33% higher, at $3.75, the only major commodity contract up on the week. Buyers still pay up for crude they can take now. January Brent closed $15.22 a barrel over the December 2027 contract, while Treasury counts no Iranian oil loaded onto vessels since Aug 24.
Since 2000, front-month gold has fallen 7% or more in 11 earlier weeks. In 10 of those 11, gold posted a lower weekly close within four weeks. Four weeks on, only four of the 11 traded above the crash week's close.
Read the full Commodities section
Conclusion
Sort the week by who held the risk. Cap-weighted index holders took this quarter's loss, while equal-weight holders are about flat. Treasury holders gained as two-year yields fell, while gold holders lost alongside stocks and BTC. In crypto, spot fund holders sold first, exchanges then liquidated longs in both waves, and the Saturday rebound liquidated the shorts.
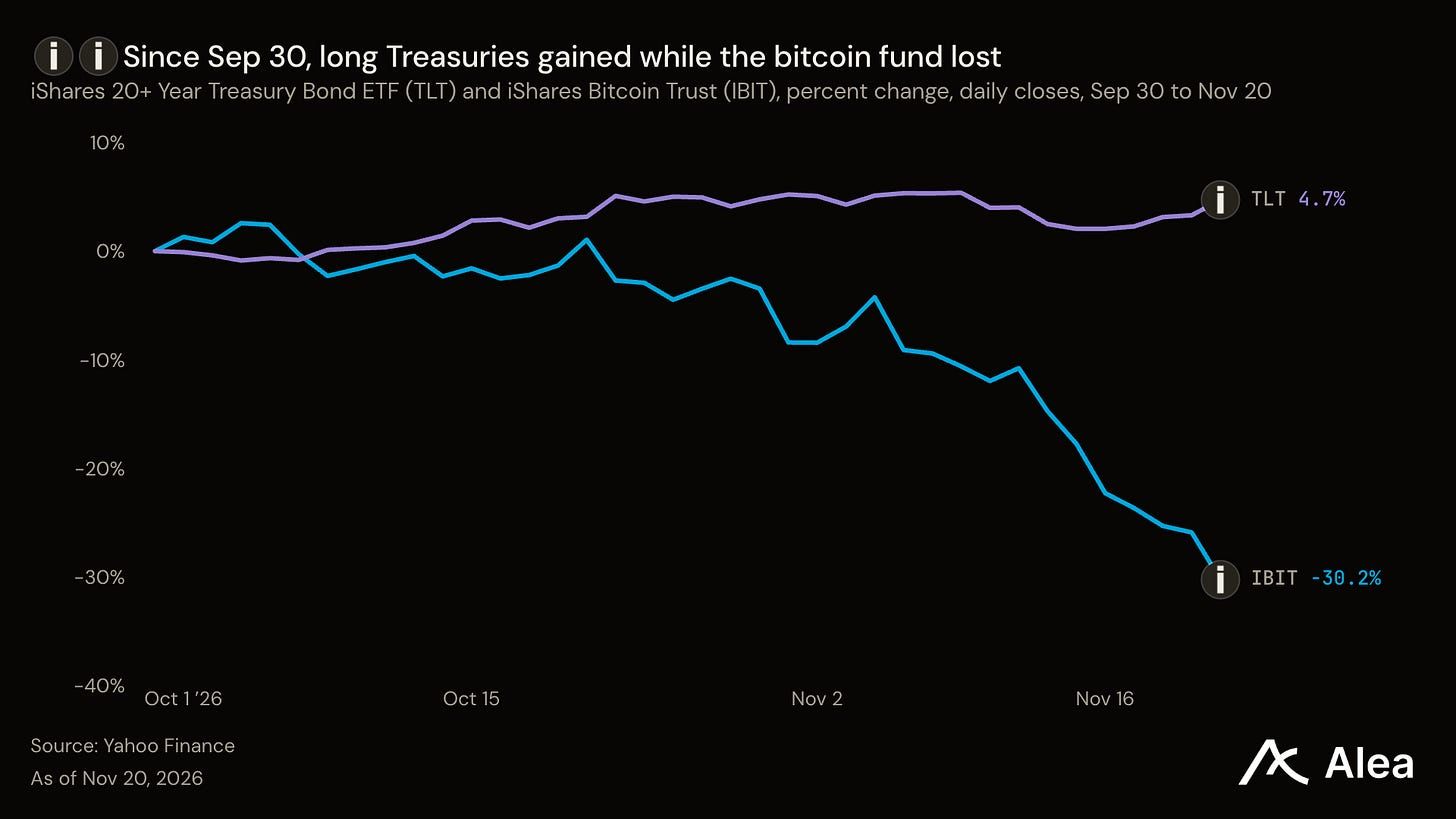
Forced selling stops when the leverage is gone. This week the leverage stayed. A crowded short is fuel for a rally, while open interest that fell only 3.8% in the rebound leaves room for another wave. The next liquidation total, and which side pays it, decides which comes first.
In stocks, the open question is index heavyweight Nvidia. Its 10-Q is due by Dec 4. MSCI removes Strategy from its USA index at the Nov 30 close, the one index-driven sale on the calendar. Before that, US markets shut on Nov 26 and close early on Nov 27, a thin week for anyone who still has to sell. Mar 12, 2020 was a scramble for cash; this Friday Treasuries rallied, and the forced selling stayed in crypto, where the leverage is still open.
Read the full edition: Alea Pulse, Nov 21. It carries every token and stock on the desk, each with its next date.

Alea Research publishes the full Pulse on alearesearch.io every week.
Research reports. Deep Dives and Blueprints explain protocols and their economics. Theses and Memos examine investment cases and catalysts. Benchmarks compare performance, while Perspectives assess specific developments.
Weekly Pulse. Read a weekly assessment of macro and the major liquid markets.
Protocol Data Rooms. Research each protocol in one place, with Analytics for historical comparisons and Intel for news and governance developments where available.
Podcast Digest and Summit Digest. Read summaries of industry conversations and events. Find Alea shows and their episodes through Podcast Digest.
Governance Tracker. Follow proposals and voting activity across protocols.
For protocol teams preparing institutional conversations, discuss research for your protocol with Alea.