This one started with a podcast. On Market Cap, EY-Parthenon's Igor Mikhalev said that Europe has under 1% of stablecoin volume, then pointed listeners at stabletracker.org, the open-source tracker he helped build. Allium supplies the corridor data behind it. In August 2026, euro-referenced tokens carried 0.564% of cross-border stablecoin value, and 94.1% of that euro total rode one route between Mexico and Turkey. Take that single corridor out and Europe's own euro usage is 0.033% of world flow. Cross-border payments are shrinking around it. The share of stablecoin float crossing a border each month fell from 2.6% to 1.1% between January 2025 and August 2026.
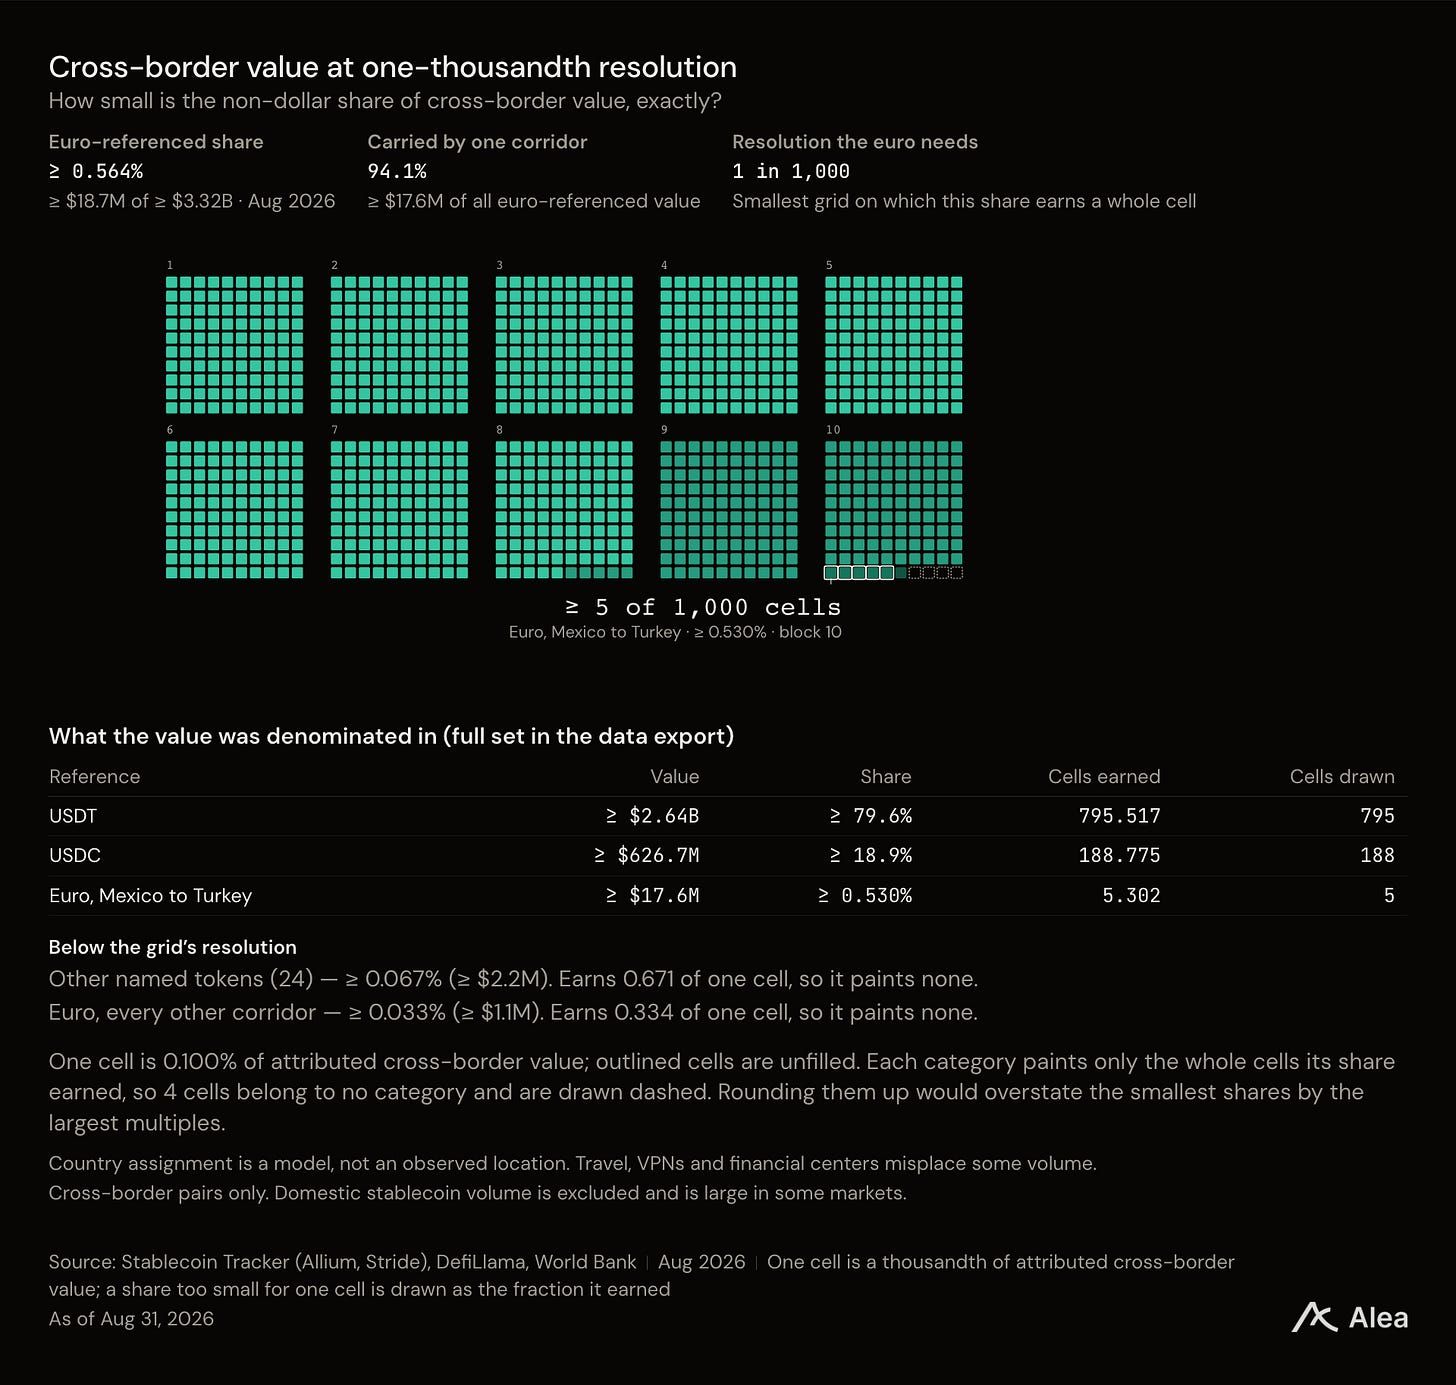
One cell is a thousandth of measured cross-border value. The euro earns five of them.
Takeaways
The rules and the money are in different countries. All 27 EU members authorize stablecoin issuers under MiCA, out of 51 jurisdictions worldwide with a law in force. Of the 12 countries where cross-border stablecoin value is material against the size of the economy, 8 have no stablecoin law at all.
The euro's entire visible presence is one corridor. Mexico to Turkey carried $17.6M of euro-referenced value in August, against $1.1M across every other route on earth.
USDT and USDC carry almost all of it. Together they moved 98.6% of attributed cross-border value in August. Every other stablecoin measured split the remaining 1.4%.
Most stablecoins do not travel. 112 tokens hold more than $10M of circulating supply and show no measured cross-border value at all.
Cross-border payments are shrinking. From January 2025 to August 2026, attributed value fell from $5.5B to $3.3B, while the count of routes carrying any value fell only from 506 to 467.
Europe wrote MiCA. The dollars went elsewhere.
MiCA is the most complete stablecoin law anyone has finished, and its stablecoin rules have bound issuers in the bloc since June 2024. Stride's regulatory tracker records a law in force in all 27 EU member states, and in only 51 jurisdictions worldwide. More than half of every stablecoin law in force is European.
Now set that against where the money goes.
Rank each country by its attributed outbound value divided by its own GDP, then split the 24 countries that have both figures at the median. Eight of the twelve above it have no stablecoin law: Thailand, Ukraine, Mexico, Indonesia, Turkey, South Korea, the Philippines, and Iran. Four do: Austria, Hong Kong, Australia, and the Netherlands.
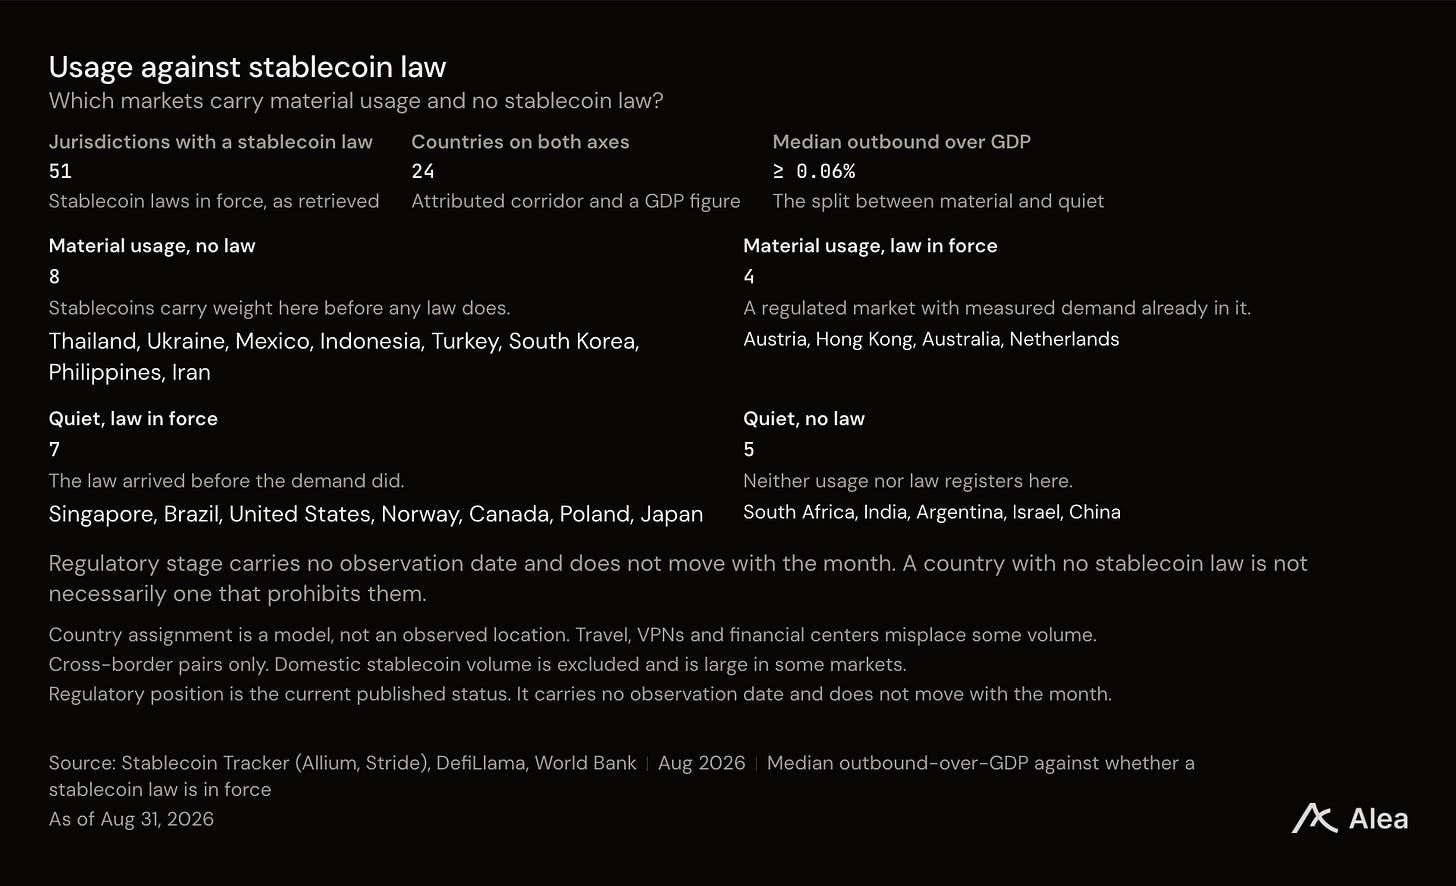
Eight countries to four, measured against the size of each economy.
Dividing by GDP cuts both ways, since the United States sends $371M a month and still lands in the quiet half, because that is a rounding error against the American economy. The point is to show where stablecoins carry substantial weight against the local economy despite no stablecoin law in force. How much the dollar moves in absolute terms is a different question.
One corridor, two countries, neither of them European
Euro-referenced tokens carried $18.7M of cross-border value in August. Of that, $17.6M moved between Mexico and Turkey. Every other euro route on earth, added together, carried $1.1M.
Neither Mexico nor Turkey has a stablecoin law in force. The largest euro-stablecoin corridor anyone can measure runs between two countries that never wrote one, and it does not touch Europe.
That route is also in an interesting transition. Between March and August 2026, EURC rose from 0.33% to 20.62% of the Mexico-to-Turkey corridor, while USDT fell from 85.0% to 58.2%. And the corridor itself did not grow. It ran at $90M in March and $85M in August. Something is swapping dollars for euros on a route that is not getting any bigger.
Why is a harder question.
Four checks narrow what it can be. This is the only route in the data carrying euros at all: every other corridor out of Mexico and into Turkey is 0% euro, Austria to Turkey included. The euros travel one way and stay, about $46M delivered into Turkey from March 2026 to August 2026 against $10K coming back. EURC's own supply grew about 10% over that stretch while the corridor's euro volume grew nearly sixtyfold, so these are existing euros turning over faster, not new ones. And it is not a currency bet: EUR/USD moved 0.9%.
Most stablecoins never cross a border
Set each token's attributed cross-border value against its own circulating supply and the gap is large.
112 stablecoins hold more than $10M of supply and show no measured cross-border value at all. 31 of them appear on at least one country pair. USDS holds $6.71B of supply and moved $73K across a border. USDe holds $4.62B and moved $16K.
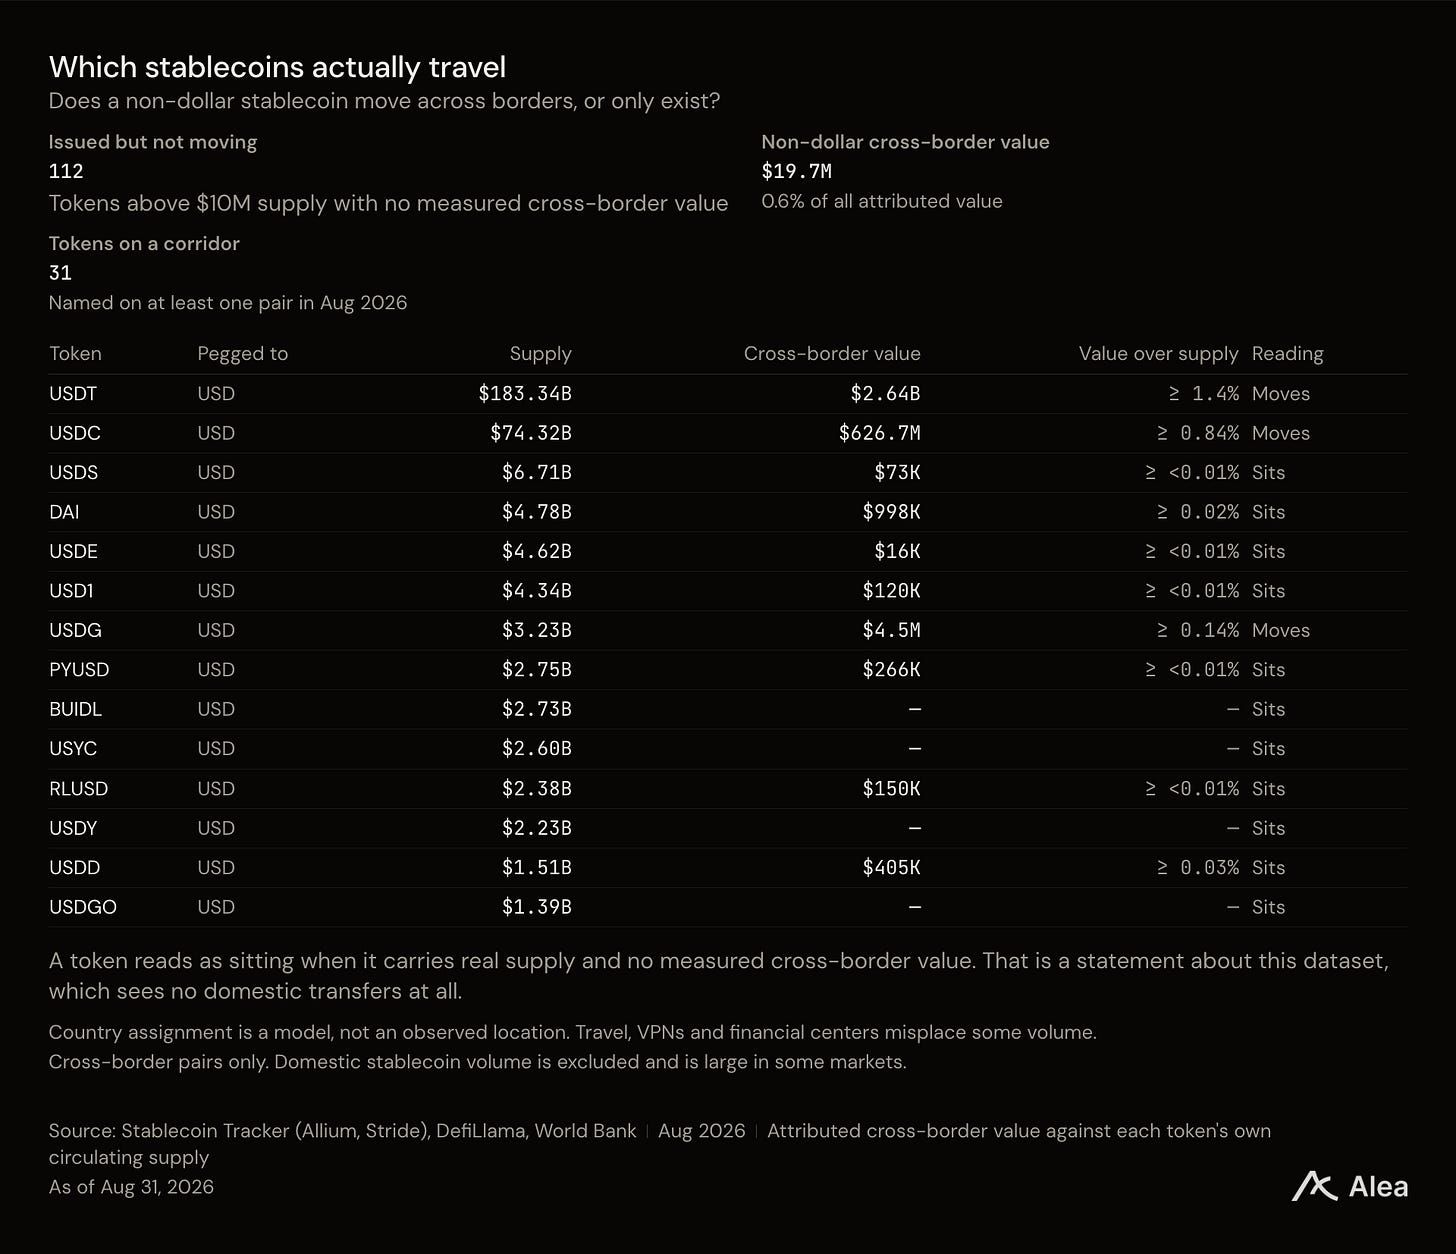
USDT and USDC move. Almost everything else … nothing, although these figures see no domestic transfers, so a token used heavily inside one country reads as sitting still in this data.
Who sends, and who receives
Most corridors run harder in one direction than the other, and the imbalances are large.
Mexico is the largest net sender at $137.4M. Singapore is the largest net receiver at $91.1M. Thailand and Mexico between them send about a third of everything measured, and the fifteen largest economies by gross flow carry 94.5% of the $3.32B total.
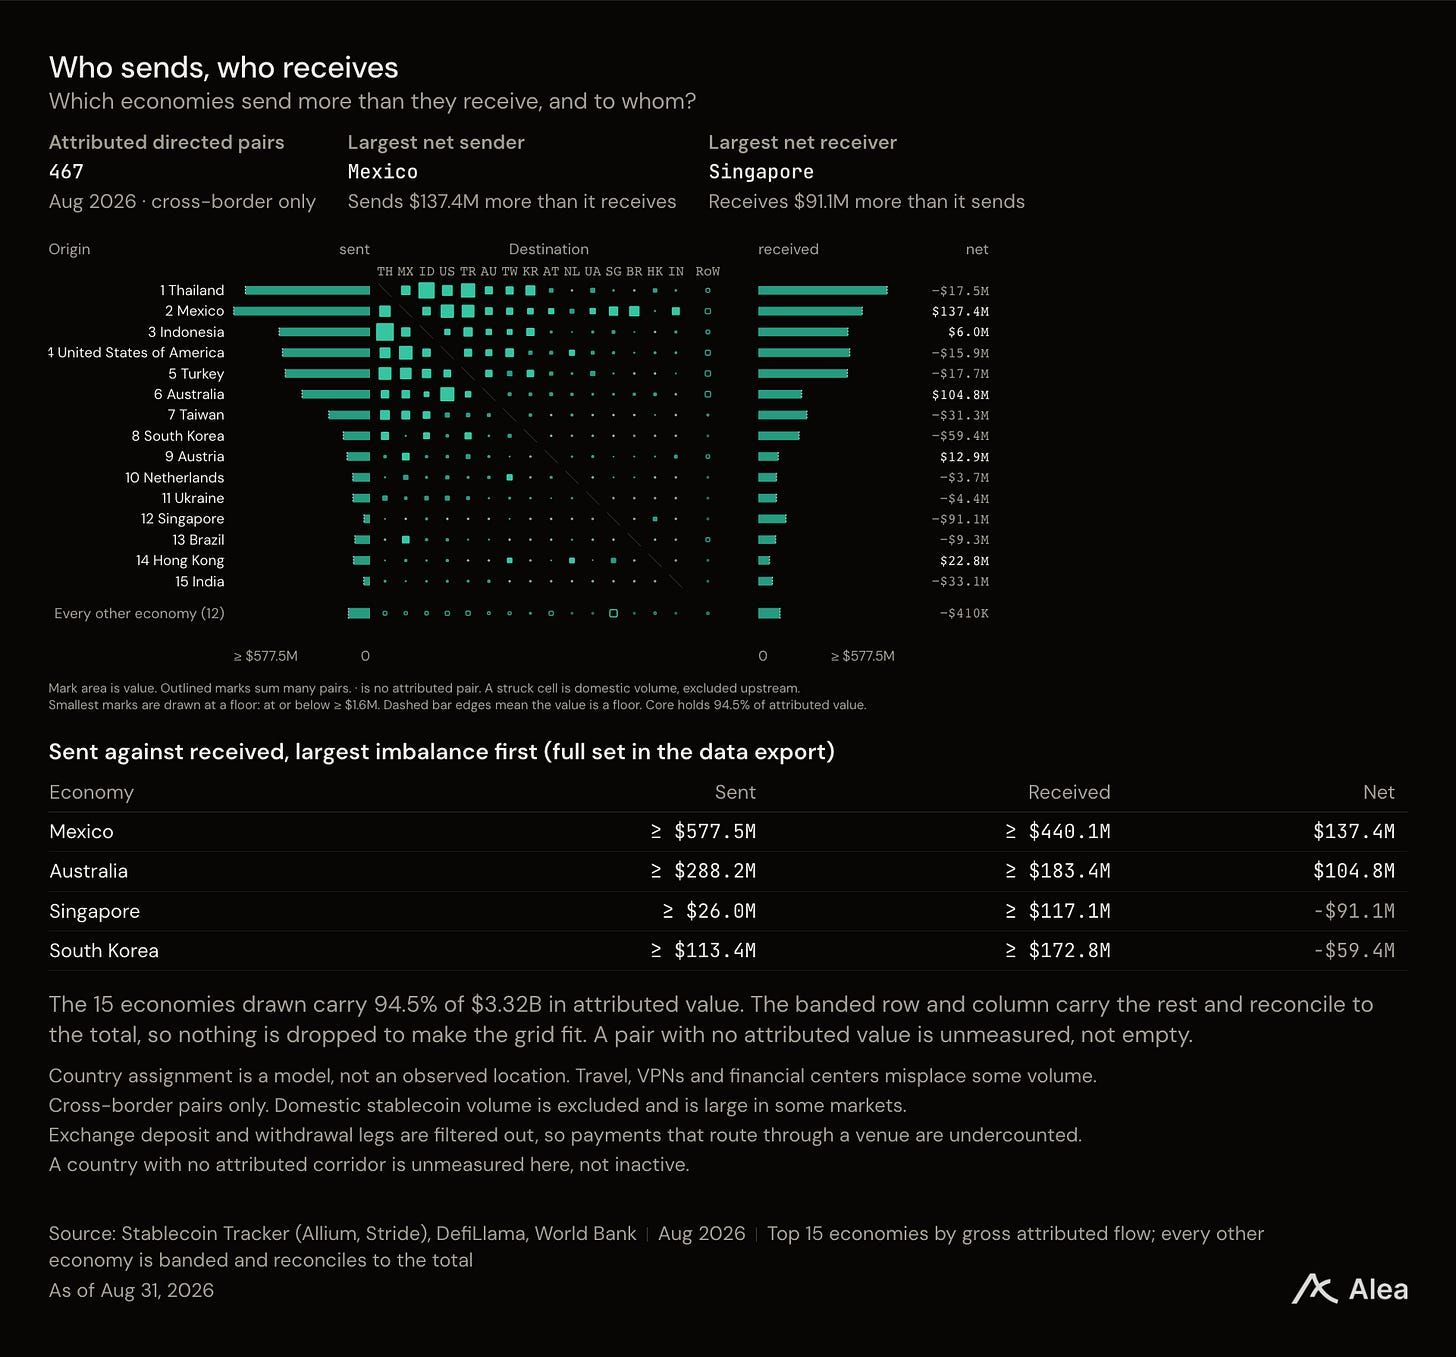
Larger squares carry more value. Austria and the Netherlands are the only European economies in the top ten.
Austria was the ninth-largest sender in August 2026, at 2.93% of world flow that month, which for a country of 9.2 million people is implausible as household payment activity. The Stablecoin Tracker's own methodology warns that financial centers misplace volume, and this looks like exactly that. If Austria is a booking artifact, Europe's measured share is smaller than 5.27%.
Cross-border value keeps falling
Twenty closed months are now published on stabletracker.org, and the trend across them is down.
Attributed cross-border value peaked at $5.59B in May 2025 and fell to $3.32B in August 2026, the lowest month in the series. Every month since February 2026 has come in below $4.3B. The share of stablecoin float that crosses a border each month fell from 2.6% to 1.1% over the same window.
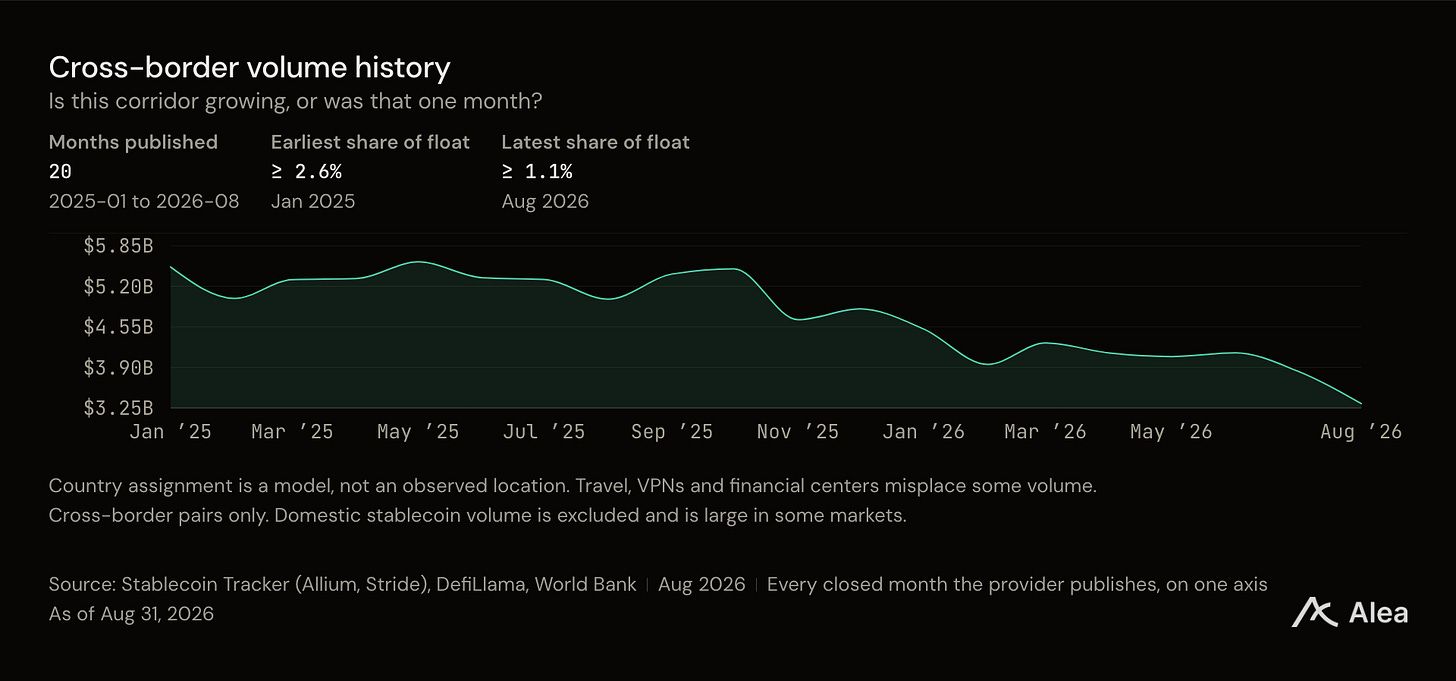
Cross-border payments shrank across twenty closed months.
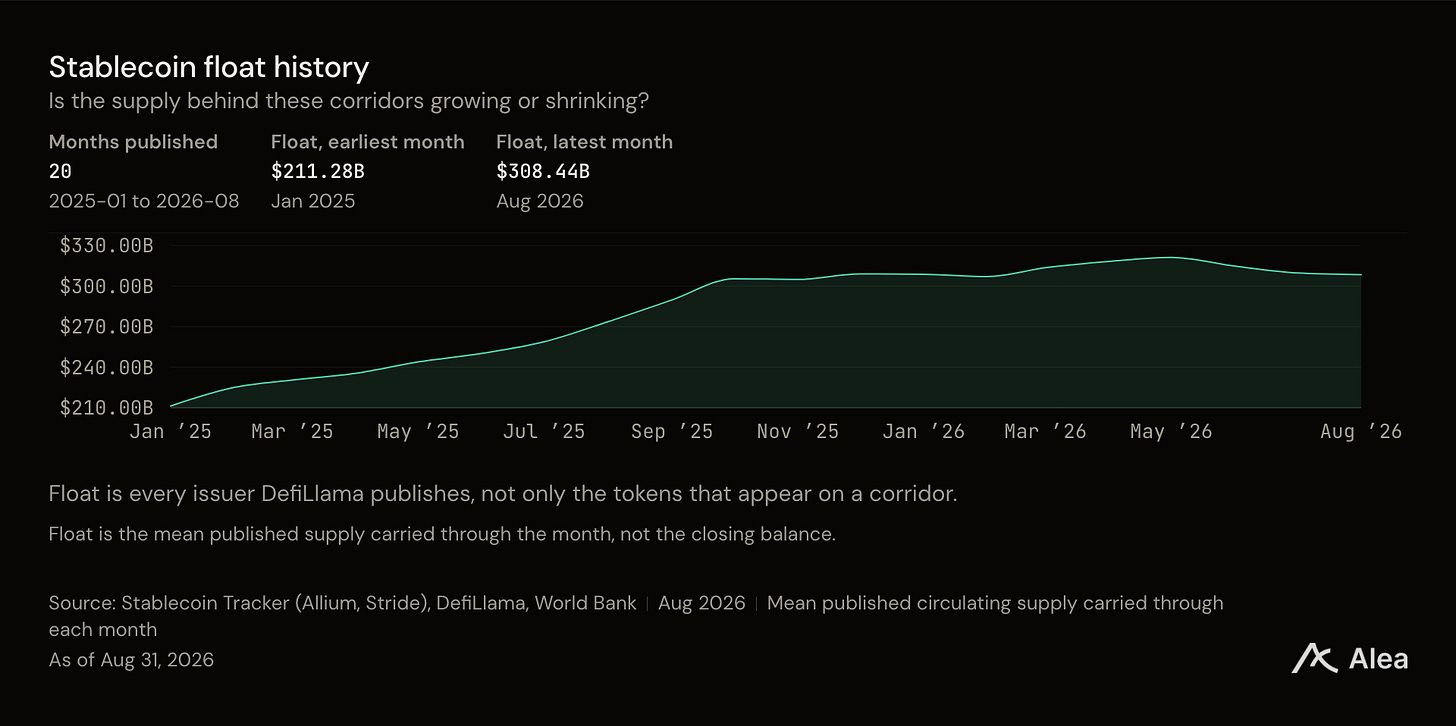
The float behind those payments rose from $211.28B to $308.44B over the same twenty months.
From January 2025 to August 2026 supply grew 46% and cross-border value fell 40%. Either the activity moved somewhere these figures cannot see, which is one of the four limits below, or cross-border payments are a smaller and more concentrated business than the supply numbers imply.
What this cannot see
Four limits sit under every number here.
Country assignment is a model. Travel, VPNs, and financial centers misplace some volume, which is why Austria deserves a flag. Domestic volume is excluded entirely, and in some markets domestic activity is most of the market. Addresses are not people. Coverage is partial too. 27 of the 209 countries Allium publishes carry an attributed corridor in any month.
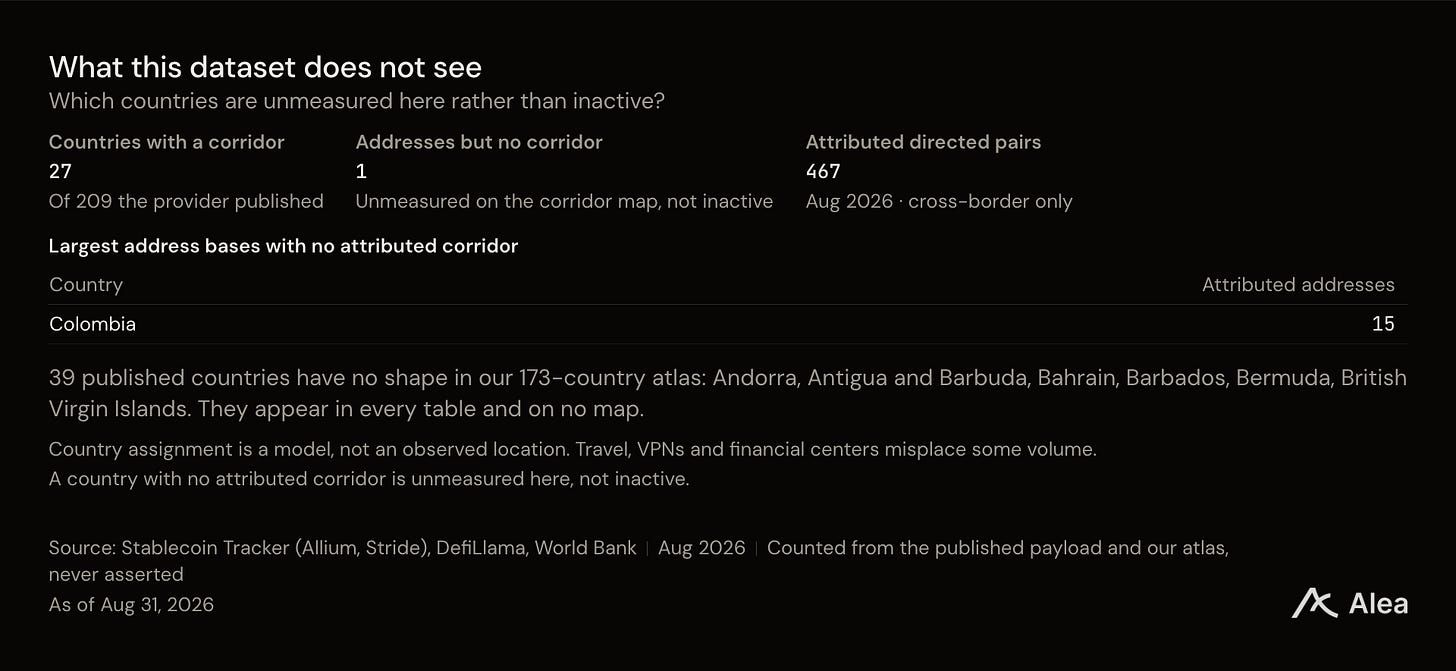
A country missing from that count is unmeasured here rather than inactive. These figures are a floor on activity, never a ceiling, which is why every ratio in the exhibits is printed with a "≥".
Important Links
Europe's 1% Share, Yield-Bearing Deposits, $1M Licenses to Innovate, the Market Cap episode with Igor Mikhalev of EY-Parthenon, September 10, 2026
Episode digest on Alea Research
Market Cap, hosted by Stefano Sanabria. Institutional crypto, on the record
Stablecoin Tracker, the country-level dataset behind every figure here. Corridor and address data are Allium; regulatory position is Stride
MiCA, Regulation (EU) 2023/1114. Its stablecoin titles have applied since June 30, 2024
Circulating supply from DefiLlama. Population and GDP from the World Bank

This edition began with a Market Cap conversation about Europe’s share of stablecoin volume. The episode digest, linked above, carries the full exchange including the licensing figures quoted here.
Research reports. Deep Dives and Blueprints explain protocols and their economics. Theses and Memos examine investment cases and catalysts. Benchmarks compare performance, while Perspectives assess specific developments.
Weekly Pulse. Read a weekly assessment of macro and the major liquid markets.
Protocol Data Rooms. Research each protocol in one place, with Analytics for historical comparisons and Intel for news and governance developments where available.
Podcast Digest and Summit Digest. Read summaries of industry conversations and events. Find Alea shows and their episodes through Podcast Digest.
Governance Tracker. Follow proposals and voting activity across protocols.
For protocol teams preparing institutional conversations, discuss research for your protocol with Alea.