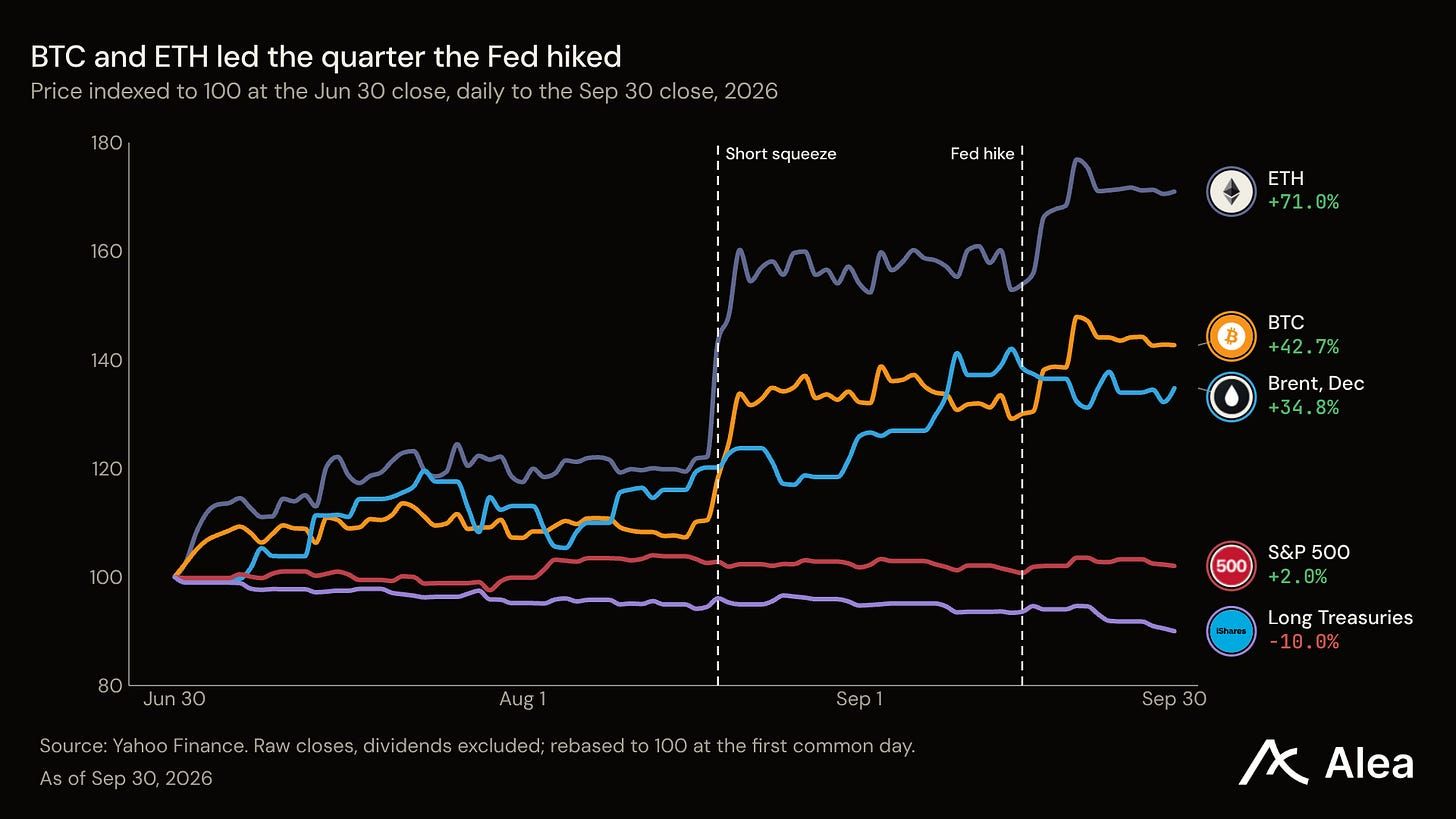
When the quarter opened, Polymarket gave a September rate hike less than a one-in-three chance. The Fed hiked on Sep 16, its first increase since July 2023, and the 10-year Treasury closed Sep 30 at 5.29%, its highest close since 2002. The asset a hike is supposed to hurt first rose the most. BTC gained 42.7%, its best quarter since late 2024, and ETH gained 71.0%, its best since early 2021.
Takeaways
The market doubted the hike, and the Fed delivered it. On Jun 30, Polymarket priced a September hike at 29.5%. The Fed raised its range to 3.75% to 4.00% on Sep 16 in a 12 to 0 vote.
Money got dearer faster than prices did. The 10-year real yield closed the quarter at 2.93%, its highest since 2008, while expected inflation barely moved.
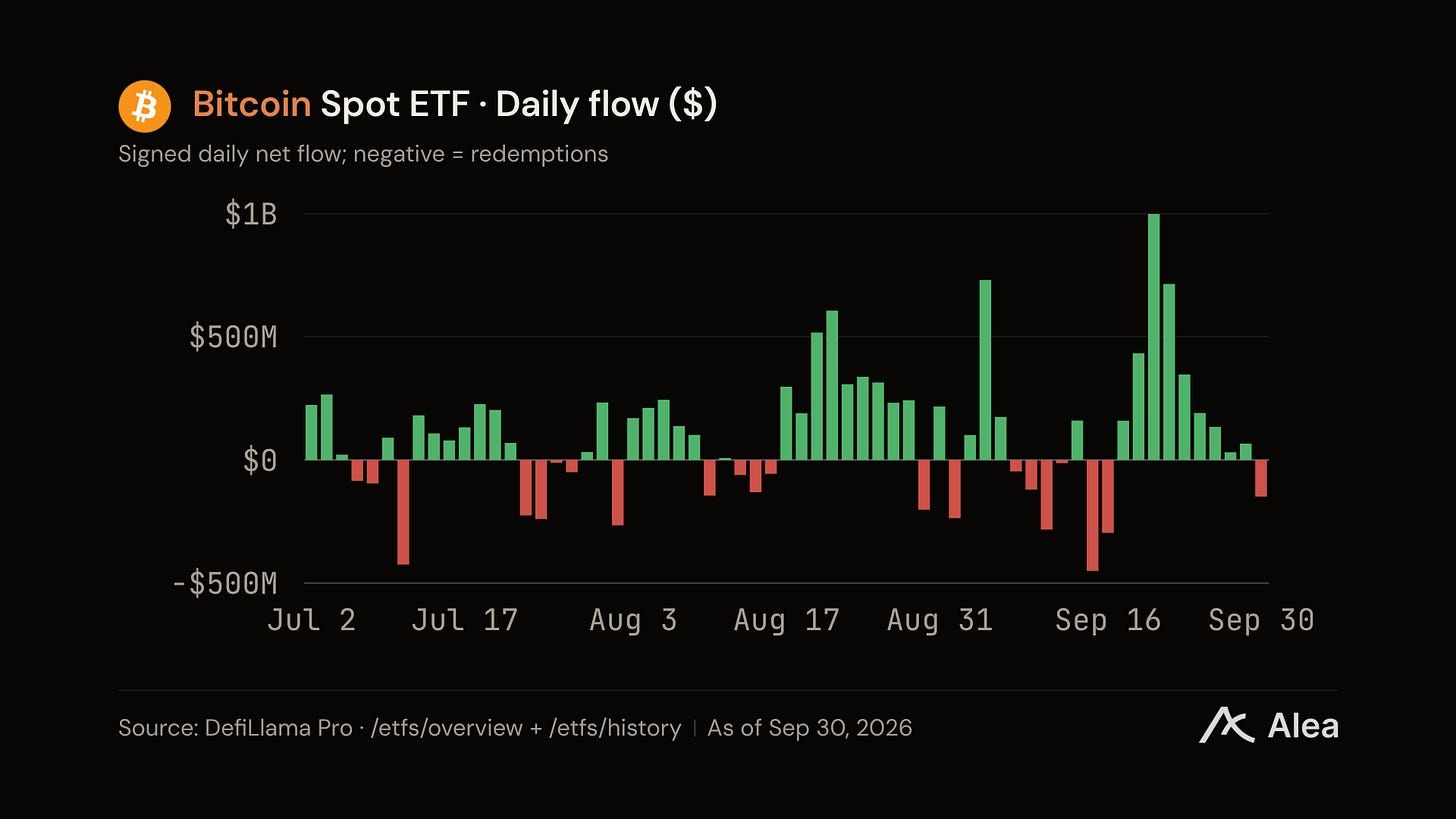
Crypto's buyers came back through spot funds, without borrowed money. US spot BTC and ETH funds took in $9.4B and reversed the spring's outflows, while perpetual open interest fell in coin terms.
Microsoft and Meta lifted the S&P 500. The index gained 2.0% while its median member lost 4.4%.
Oil was the other winner. December Brent rose 34.8% as the Strait of Hormuz stayed contested, and two refiners made the S&P 500's top eight.
Bonds and borrowers lost ground to the hike. Long Treasuries fell 10.0%, and homebuilders and utilities were the weakest of 13 sector groups.
Cross Asset Market: Crypto and Oil Took the Quarter
Two costs rose across Q3: the price of money and the price of oil. The biggest gains went to crypto and to oil itself, with ETH, BTC, and December Brent each finishing more than a third higher. The S&P 500 and the Nasdaq 100 ended close to where they started, long Treasuries lost a tenth of their value, and the dollar index rose 0.3%.
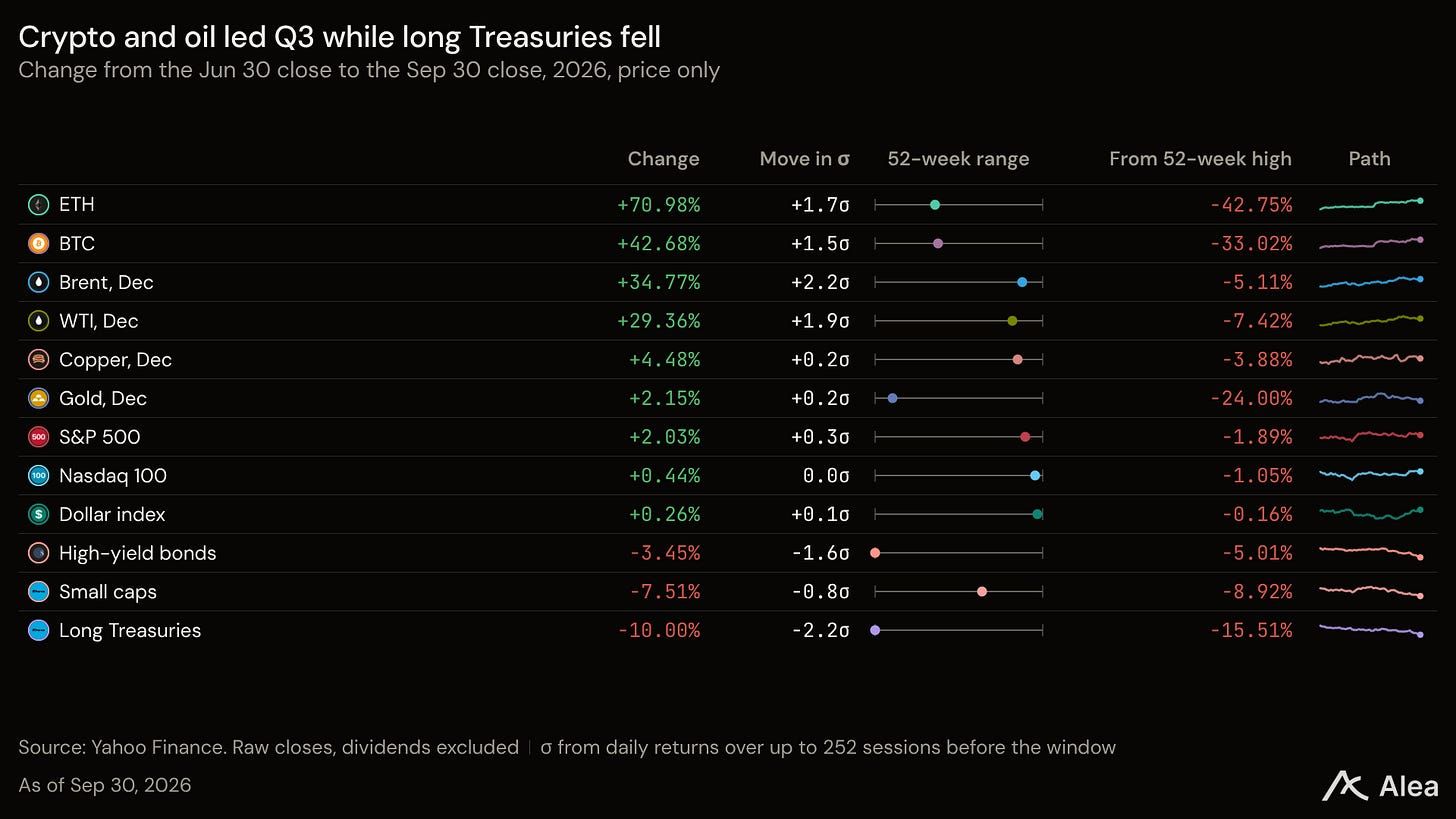
Leadership changed each month, starting with oil in July, when front-month WTI rose 21.8% and chip stocks fell 21.2%. Crypto and gold led in August, as BTC gained 25.0% and front-month gold 9.1%. September belonged to rates, as the 10-year yield climbed from 4.75% to 5.29%, and to the largest stocks, led by Meta. Over the quarter, participation was wide in crypto and thin in US stocks, and equity volatility ended where it began: the VIX closed Sep 30 at 16.3, against 16.5 on Jun 30.
Macro: The Hike Came, and Money Got Dearer
The market spent most of Q3 pricing a hold. On Jun 30, Polymarket gave a September hike 29.5% and no change 62.5%. The hike price first passed 50% on Jul 22, the day before front-month Brent closed above $100, and a week later three Fed officials voted for a hike that the majority declined. Then July payrolls fell by 23,000, the Labor Department reported on Aug 7, and the hike price dropped to 27.5% within a week.
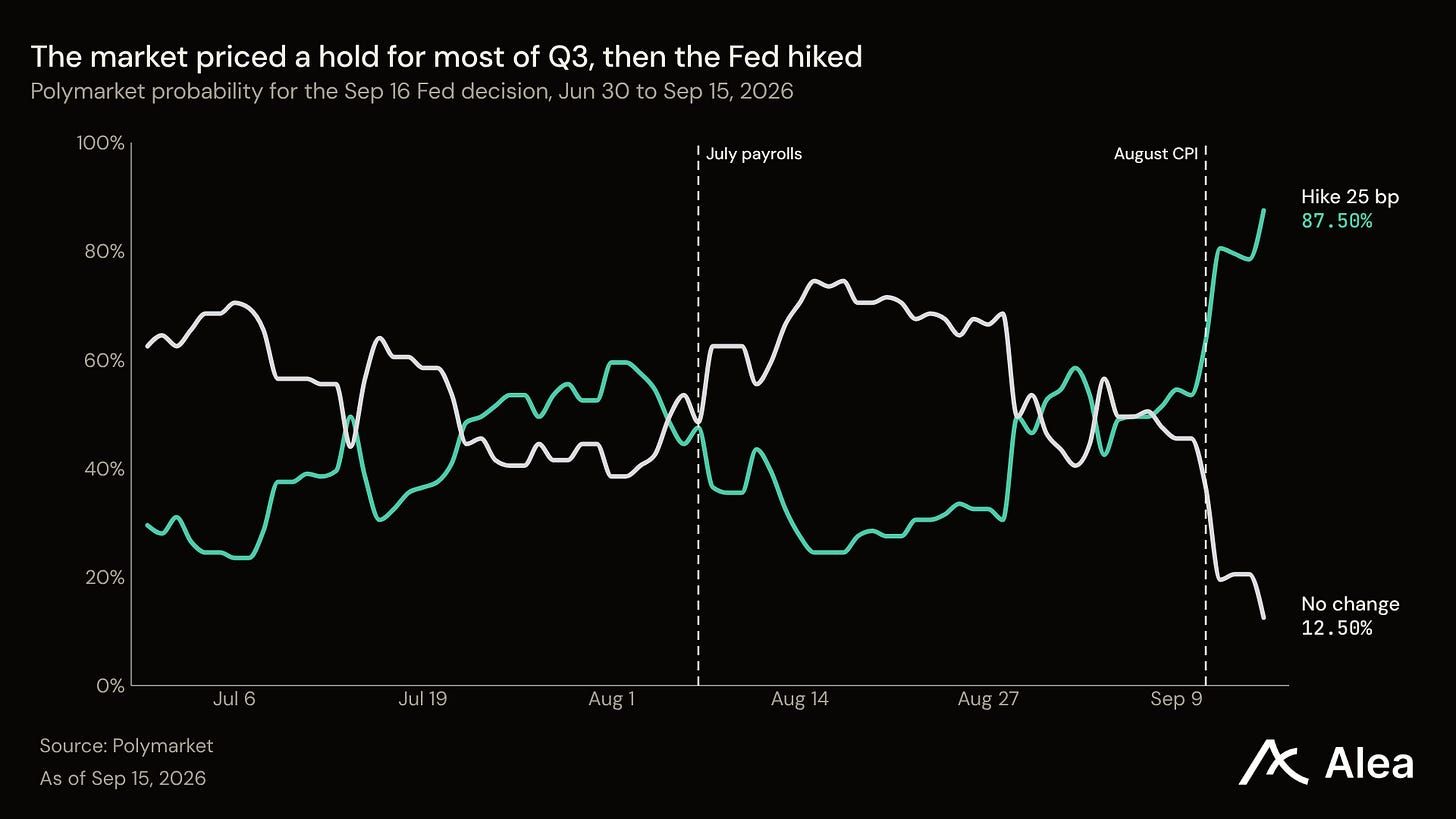
Two events settled it. At Jackson Hole on Aug 28, Fed Chair Kevin Warsh called the 2% goal "a firm, fixed target." August consumer prices then rose 0.4% on the month, the Labor Department reported on Sep 11, and the hike price reached 87.5% by Sep 15. The Fed raised its range the next day, with no dissent. Its statement said economic activity "is expanding at a solid pace." With the hike 87.5% priced, the decision itself didn't move markets much: long yields barely changed on the day, and two sessions later BTC stood 7.0% above its close before the decision.
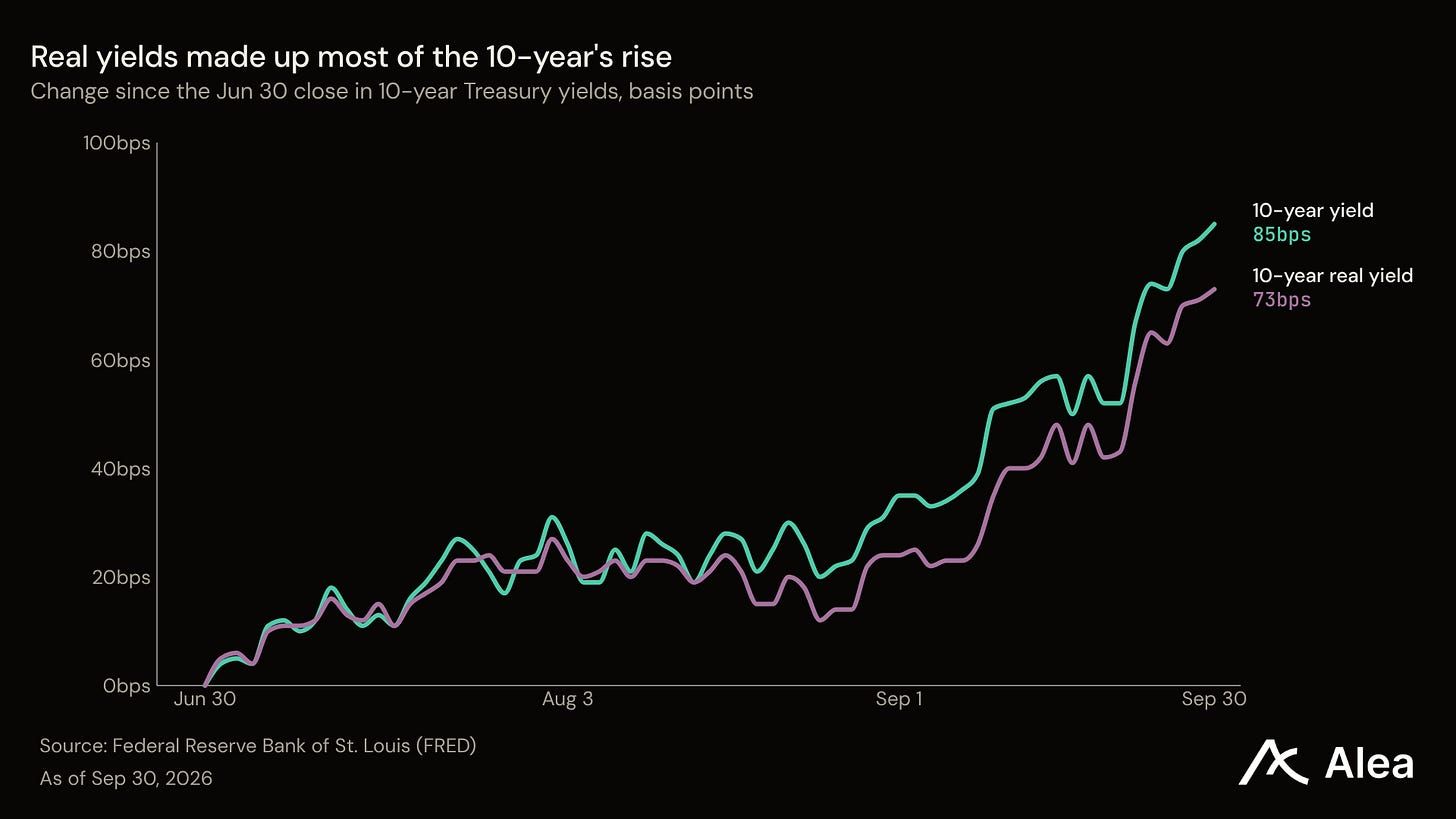
Bond buyers charged more to lend, and kept their inflation forecast almost where it was. On the Treasury's par curve, the 10-year rose 85 bp to 5.29%. The 2-year and the 30-year each rose about 74 bp. The 10-year real yield, the return a buyer locks in after expected inflation, rose 73 bp to 2.93%, its highest close since November 2008. Breakeven inflation, the rate of inflation those two yields imply, moved from 2.24% to 2.36%. The curve steepened too, as the 10-year's lead over the 2-year widened from 30 bp to 41 bp. Treasury sold 30-year bonds at 5.216% on Aug 13, and six days later it announced long-bond buybacks of at least $4B per operation, double the prior maximum.
The Fed decides next on Oct 28, and the quarter ended with a second hike priced as the less likely outcome. New York Fed President John Williams said on Sep 29 that there is "no need for urgency." The next morning, August core PCE prices rose 0.2% on the month, the Commerce Department reported. By the Sep 30 close, Polymarket priced an October hike at 33.5%, down from 68.5% two days earlier. September payrolls, the last jobs report before that meeting, are scheduled for Oct 2.
Crypto: Spot Buyers Paid for the Rally
Crypto's gains spread across the market. Of 79 tokens in the top 100 by market value, 71 rose in Q3, and the median gain was 49.7%. Quant, Pump.fun, Ethena, Zcash, and Uniswap each gained more than 200%. Pump.fun directed $66.5M of revenue to PUMP holders in Q3, against $56.0M in Q2. Holder revenue at Uniswap rose from $13.5M to $29.2M. Among the largest tokens, HYPE rose 40.1%, in step with BTC.
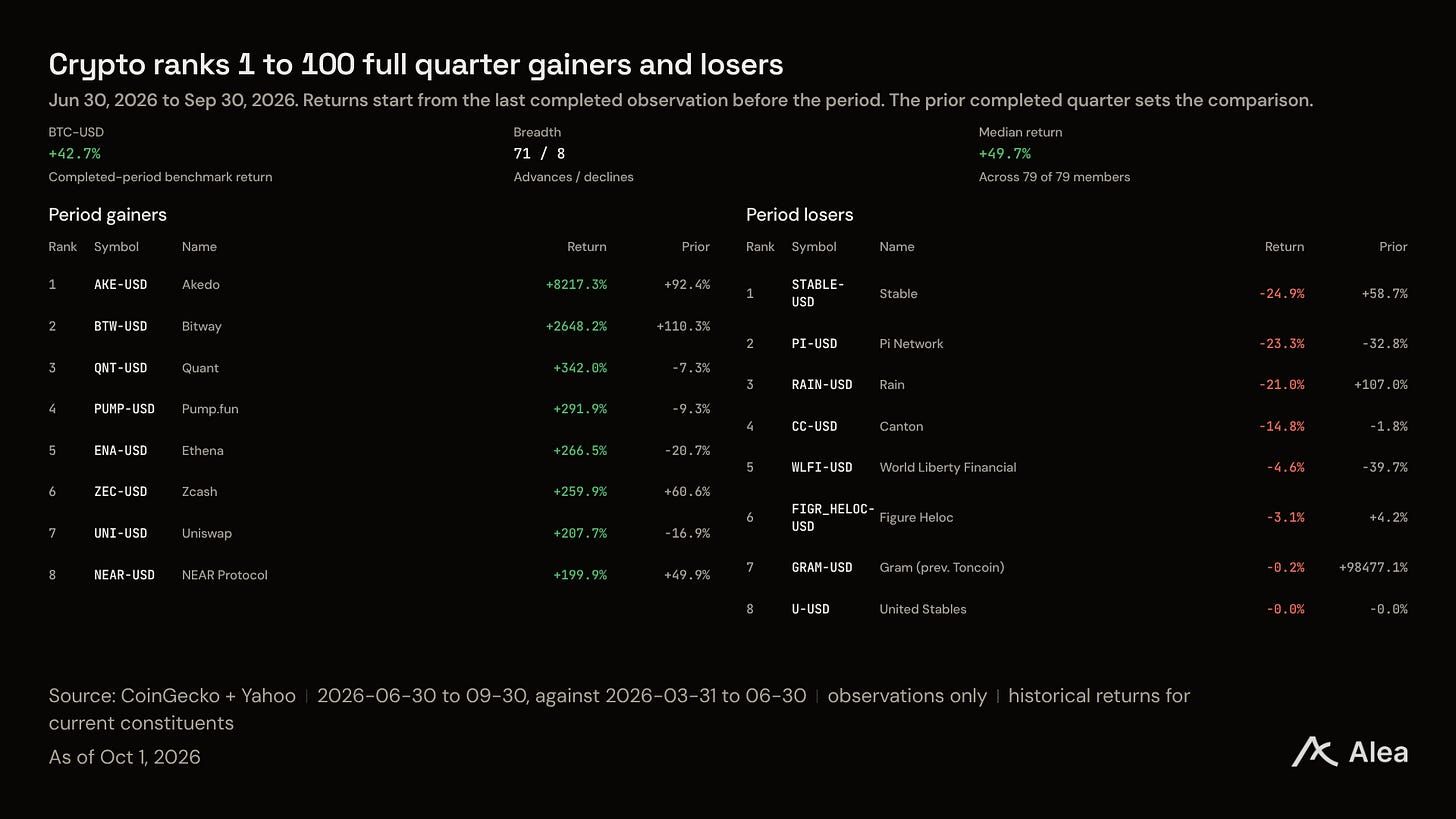
BTC's quarter turned in three days: it gained 10.5% in the seven weeks to Aug 18, then climbed 21.1% from Aug 19 to Aug 21 as short sellers were forced out. On Binance alone, $689M of short positions in BTC and ETH perpetuals were liquidated on Aug 19, the most of any day in the quarter. Spot BTC funds took in $1.4B over the same three days, and the buying didn't stop when the squeeze did.
The buyers who left in the spring came back. US spot BTC funds took in $6.4B in Q3 and ETH funds $3.0B. In Q2, the two had lost $5.6B. Most of that money arrived late, with 82% of the BTC fund inflow landing on or after Aug 19. Spot SOL funds added $431M. Relative to size, ETH funds bought about three times as much as BTC funds: their inflow equaled 1.6% of ETH's market value on Jul 1, against 0.5% for BTC. ETH rose 19.8% against BTC over the quarter.
Borrowed positions shrank while the price rose: on Binance, BTC perpetual open interest fell 12.1% in coin terms from Jun 30 to Sep 30, and funding, the fee that holders of long perpetual contracts pay to shorts, sat below its 0.01% default rate on 81 of 92 days. Longs paid less than usual to hold their positions. The rebound did start at the bottom of a hard first half: BTC opened Q3 at its low for 2026 and closed Sep 30 still 33.0% below its October 2025 high. The new money came through the funds, while stablecoin supply, the dollars that trade onchain, rose 0.6% to $310.7B.
Equities: A Few Giants Lifted the Index
Microsoft and Meta led the largest members of the S&P 500. Microsoft reported on Jul 29 that its commercial backlog rose 84% to $678B. The stock rose 15.5% the next day and finished the quarter up 37.5%. Meta launched Muse, a personal AI agent, on Sep 8. The app recorded more than 2.5M downloads in its first 13 days, and Meta gained 26.7% in September.
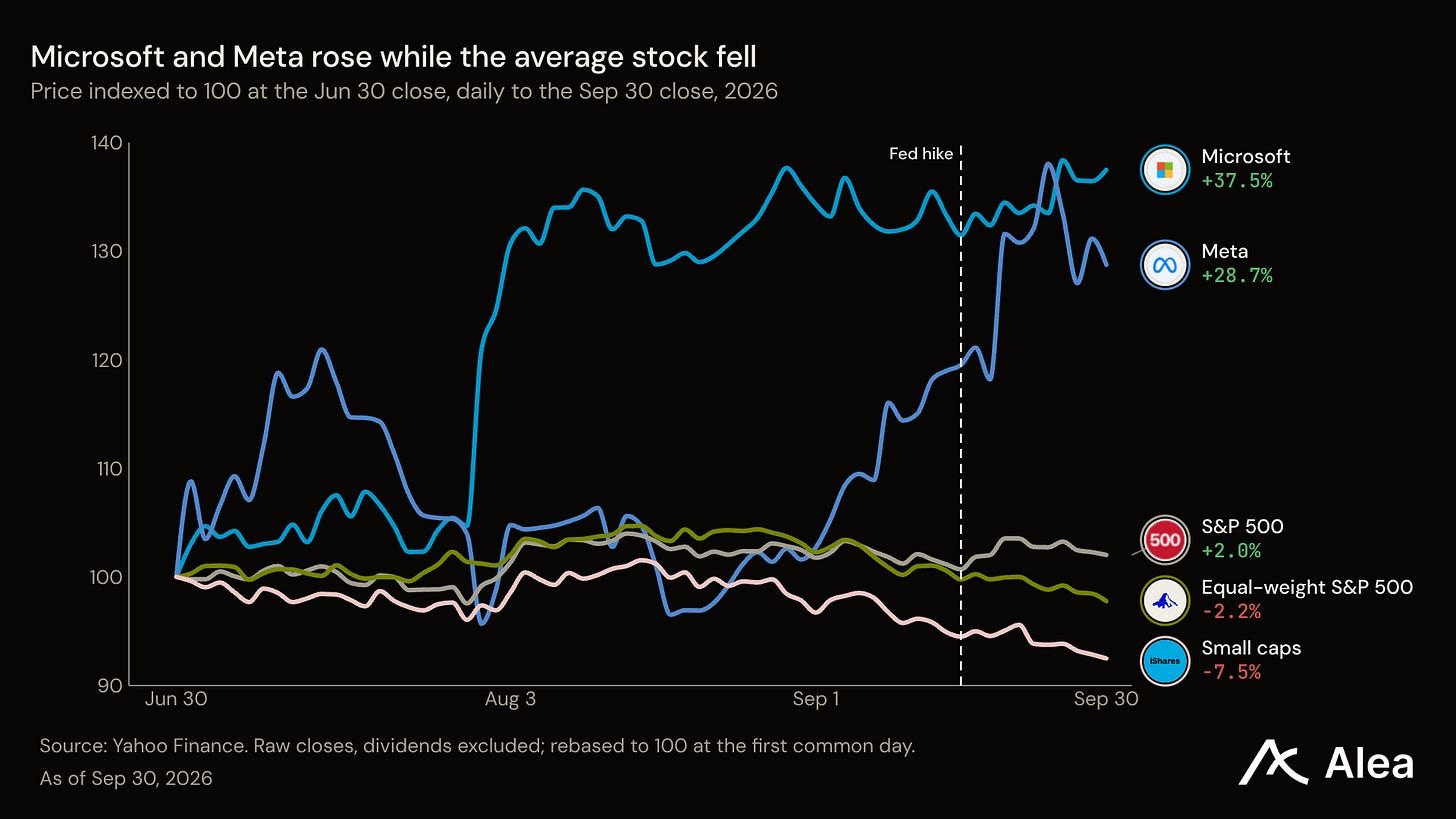
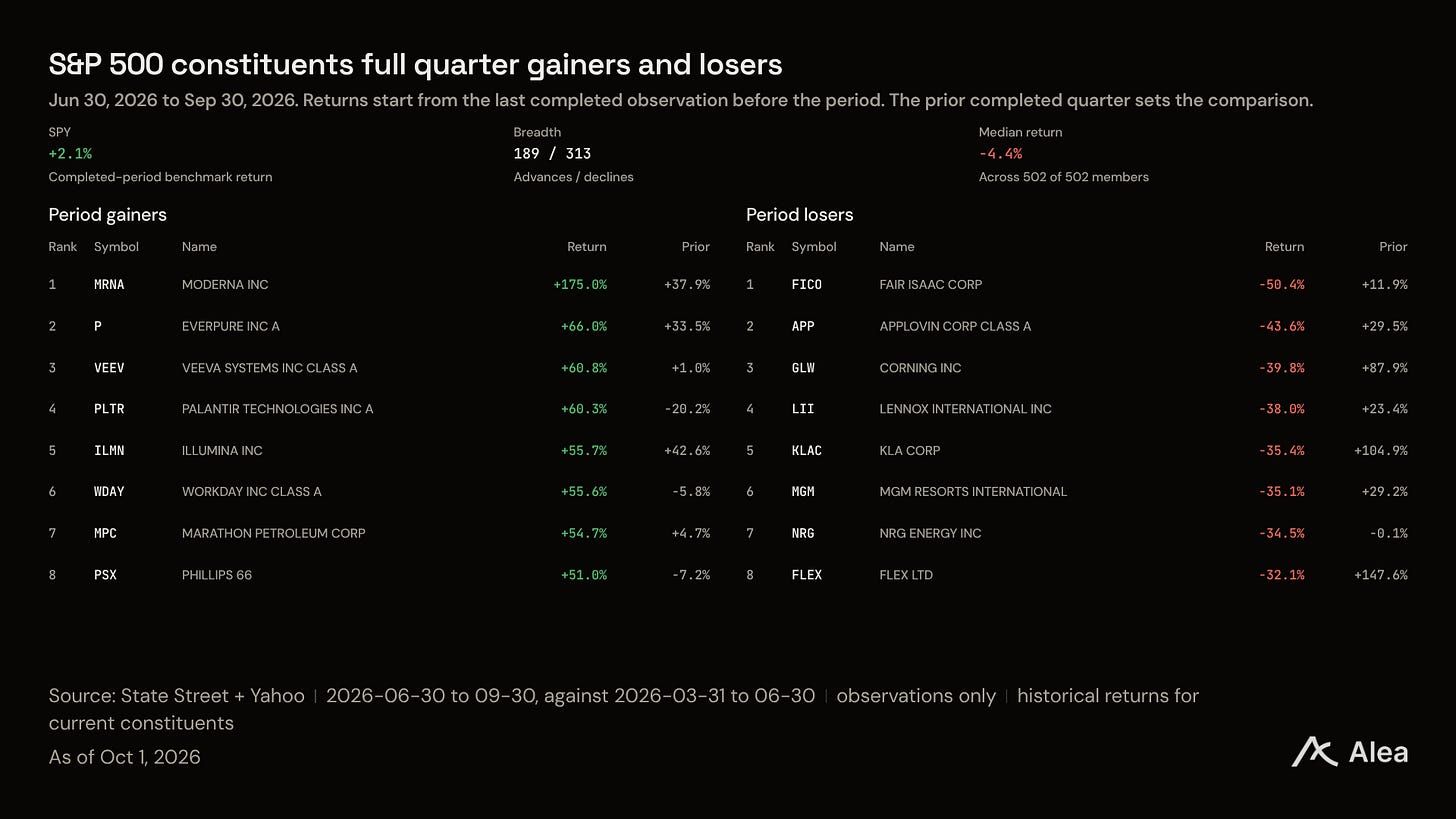
The average stock fell: 313 of 502 members ended lower, and the equal-weight fund lost 2.2% after trailing the cap-weighted fund in every week from late August to the quarter's end. Small caps lost 7.5%. Two refiners made the top eight as crude climbed, with Marathon Petroleum up 54.7% and Phillips 66 up 51.0%.
Energy and health care led the sectors, and rate-sensitive groups paid for the hike: utilities fell 13.0% and homebuilders 16.7%. Semiconductors fell 21.2% in July and recovered 11.3% in September. The Nasdaq 100 traced the same path and finished the quarter up 0.4%.
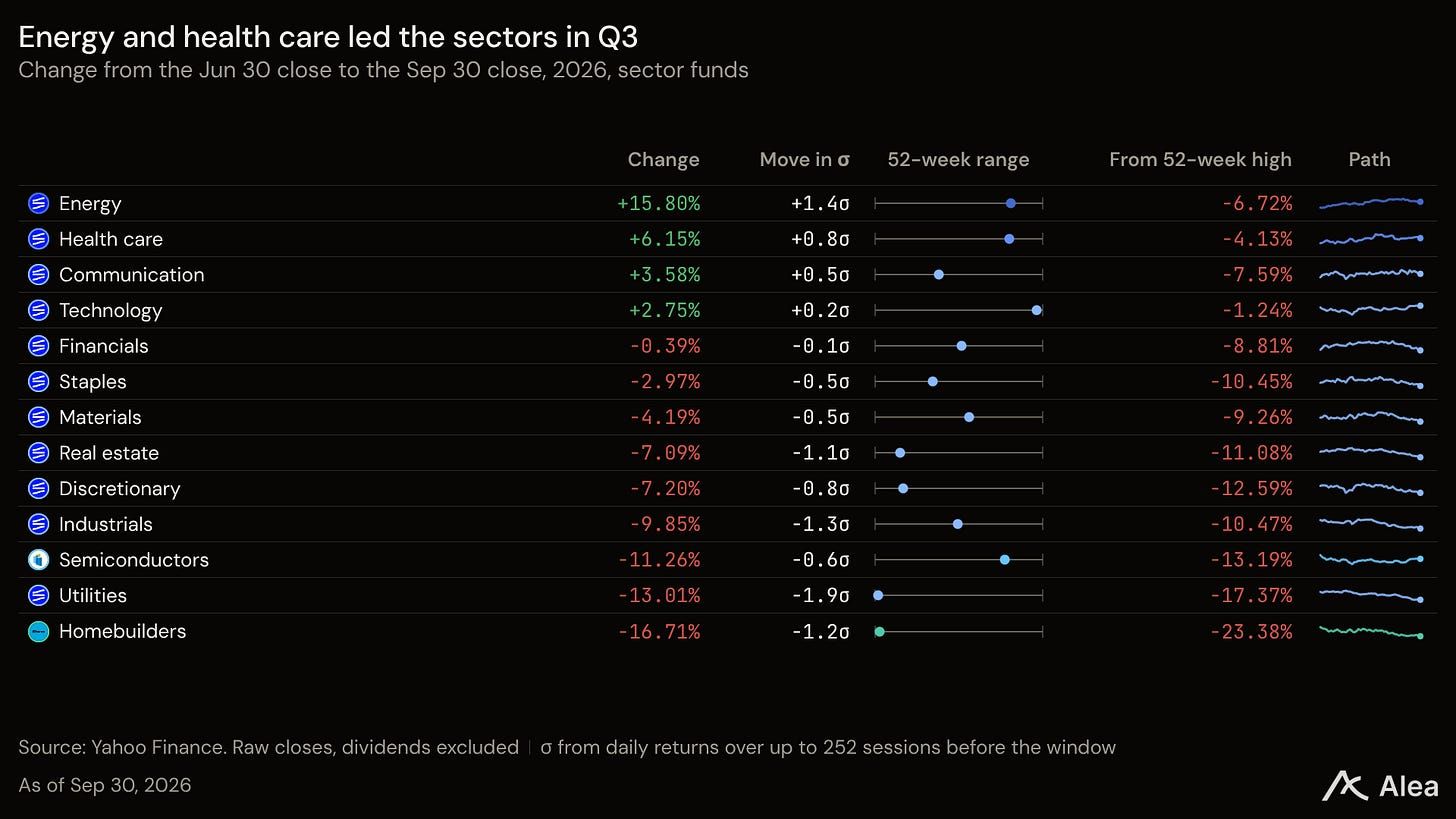
AI and crypto supplied the other large winners. Nvidia reported revenue of $96.2B on Aug 26, up 106% from a year earlier. Its stock gained 14.1% in Q3, and Palantir gained 60.3%. Crypto's rally reached listed stocks, as Strategy, the largest corporate holder of BTC, rose 76.1%, and Coinbase rose 27.5%.
Commodities: Hormuz Kept Oil Bid
Oil spent the quarter priced off the Strait of Hormuz. December Brent rose 34.8% and December WTI 29.4%. The path followed the strait: US strikes on Iran entered a ninth day on Jul 20, and one tanker crossed the strait on Jul 23. Brent's gain shrank to 5.3% after Iran and Oman announced an understanding on Aug 5. The climb resumed once the June ceasefire's window ended on Aug 17.
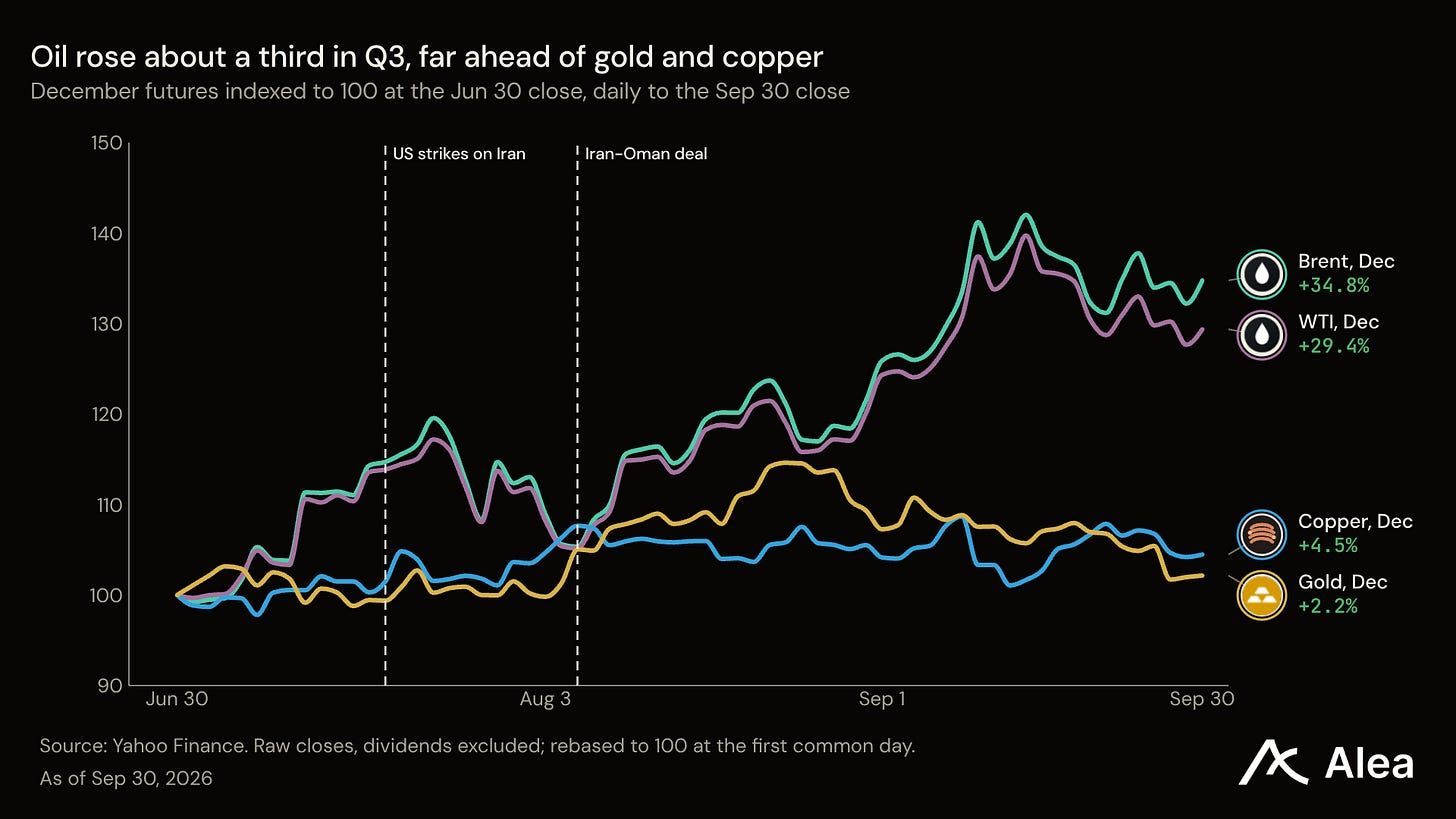
Tanker freight multiplied: the BWET fund, which tracks tanker freight futures, rose 441% in Q3. Gold took the other path: December gold peaked on Aug 24, then gave back most of that gain in September as real yields climbed and finished up 2.2%, while copper rose 4.5%. Barrels for near delivery stayed scarce into the quarter's end. On Sep 30, November Brent settled at $104, $5.50 a barrel above the December contract, a premium buyers pay only when they need oil sooner.
The Verdict: The Buyers Beat the Hike
Q3 broke the belief that the Fed would wait, and crypto still led every major market. The hike raised the cost of money more than the expected rate of inflation, and long bonds, small caps, and homebuilders paid for it. Crypto led with buyers who paid in cash: spot funds took in $9.4B, borrowed positions shrank, and the gains reached most of the top 100. Outside crypto, the gains went to Microsoft and Meta, which showed fresh demand for their AI products, and to oil, whose supply route stayed contested. The quarter rewarded assets with fresh demand behind them and charged the ones that depend on cheap borrowing.
Important Links
Bureau of Labor Statistics: Consumer Price Index, August 2026
Bureau of Economic Analysis: Personal Income and Outlays, August 2026

Weekly Pulse covered each week of this quarter, across the Fed path, Treasury yields, crypto, equities, and commodities. Pulse reports come with an Alea Plus or Pro plan.
Research reports. Deep Dives and Blueprints explain protocols and their economics. Theses and Memos examine investment cases and catalysts. Benchmarks compare performance, while Perspectives assess specific developments.
Weekly Pulse. Read a weekly assessment of macro and the major liquid markets.
Protocol Data Rooms. Research each protocol in one place, with Analytics for historical comparisons and Intel for news and governance developments where available.
Podcast Digest and Summit Digest. Read summaries of industry conversations and events. Find Alea shows and their episodes through Podcast Digest.
Governance Tracker. Follow proposals and voting activity across protocols.
For protocol teams preparing institutional conversations, discuss research for your protocol with Alea.