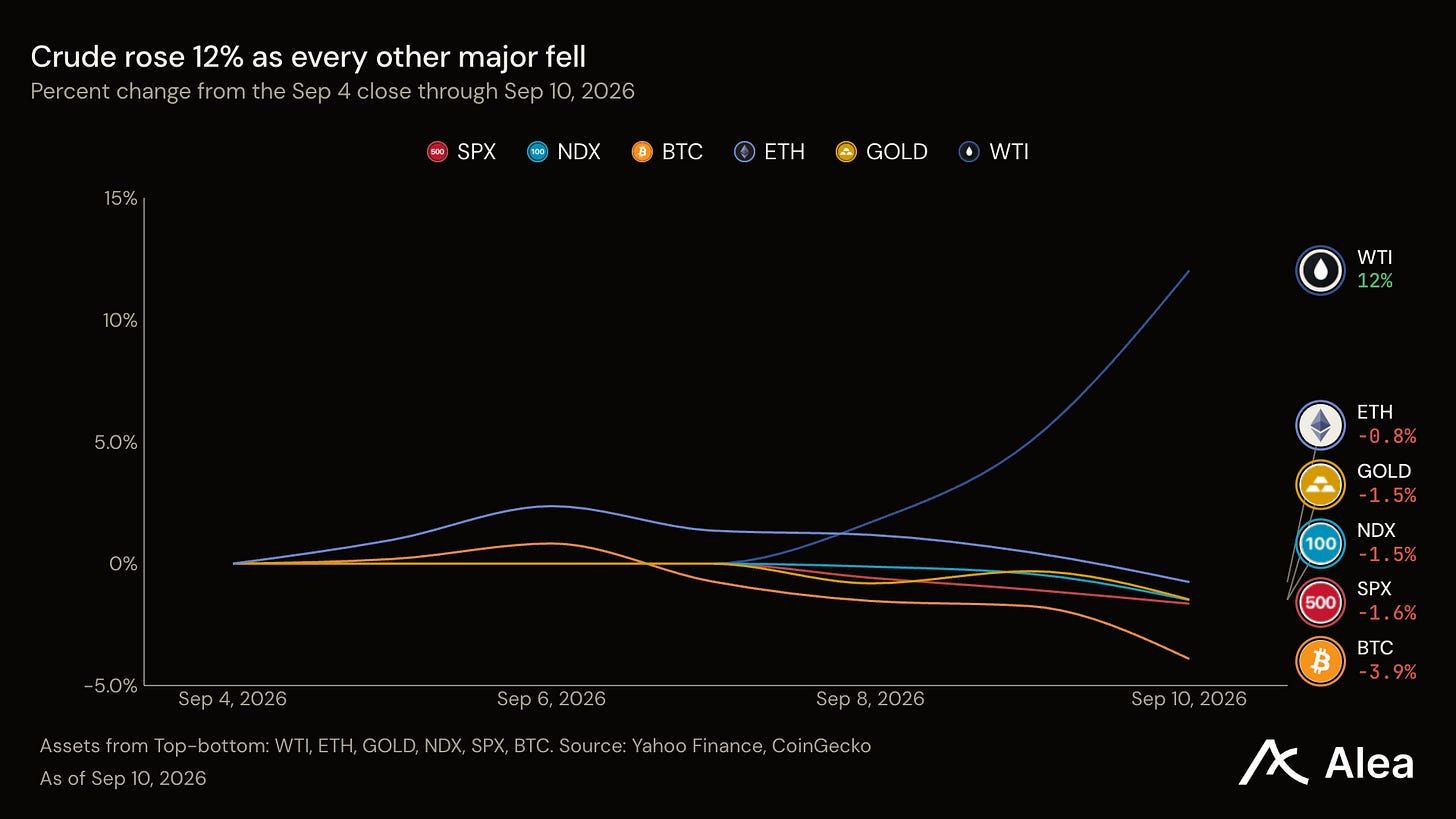
WTI settled Thursday at $102.48, up +12.0% from the prior Friday and its third-largest weekly gain in a year. Every other major fell: gold −1.5%, the S&P 500 −1.6%, BTC −3.91%. Friday morning the Aug consumer price index settled the argument: prices rose +0.4% on the month after +0.1% in Jul, and gasoline alone supplied more than a third of that increase. The Fed decides Wednesday, Sep 16.
Takeaways
Consumer prices confirmed the pass-through. Aug CPI rose +0.4% after +0.1% in Jul, with gasoline up 3.9%. Traders had priced exactly that: Kalshi’s most likely outcome was +0.4%, at 49%.
The index hid the damage. Only 76 of 503 S&P 500 members rose, the narrowest week in a year. The median member fell −2.41% against the index’s −1.64%.
BTC lagged its own market. It fell −3.91% and trailed 78% of the top 100 crypto assets, while US spot funds redeemed $449.5M across three sessions.
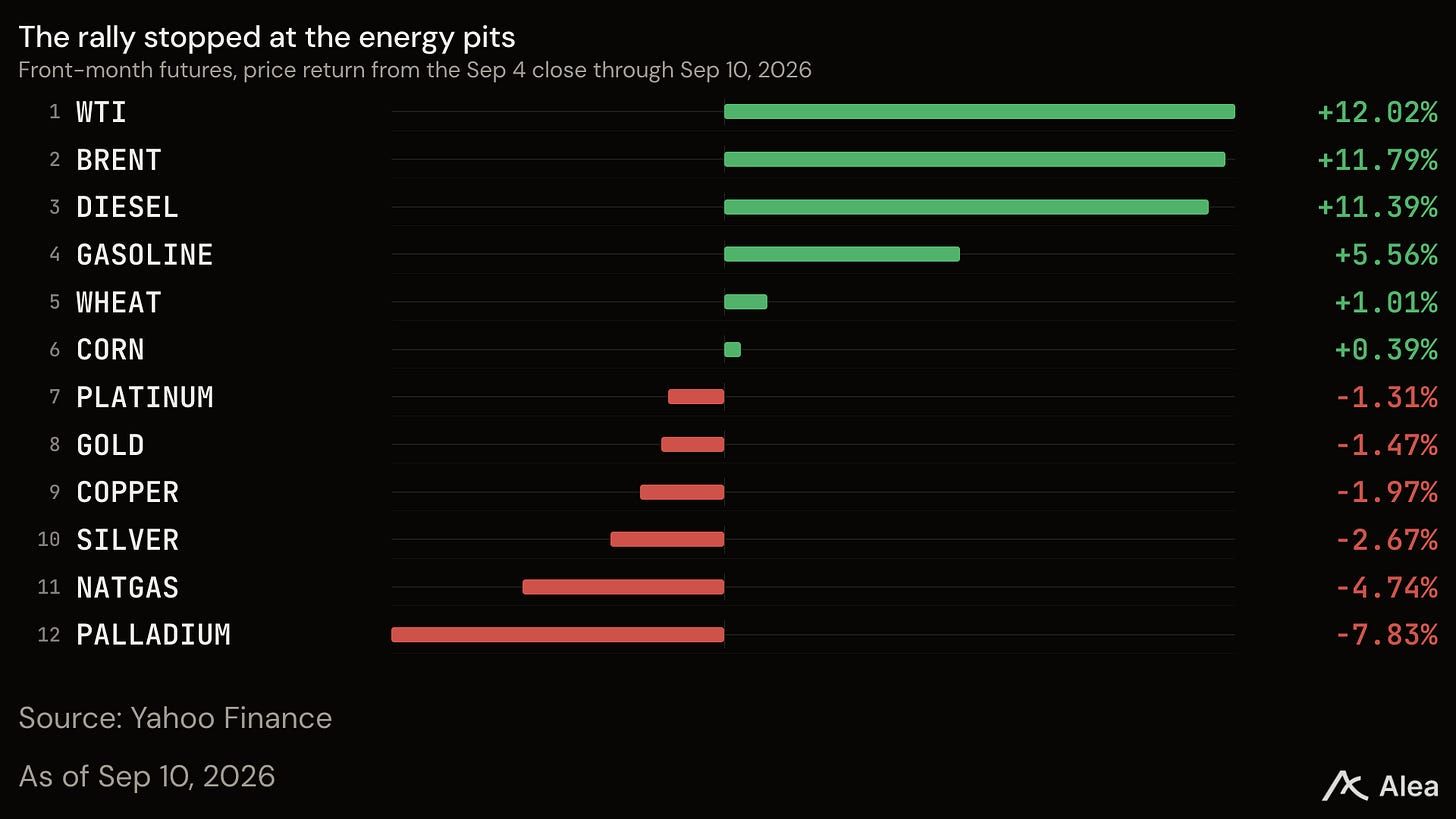
Energy stood alone. Crude, Brent, diesel, and gasoline took the top four commodity places. Gold, silver, copper, and palladium all fell.
The crowd moved first, and it was right. Odds of a Sep rate rise climbed on Kalshi before the print, and the print vindicated them.
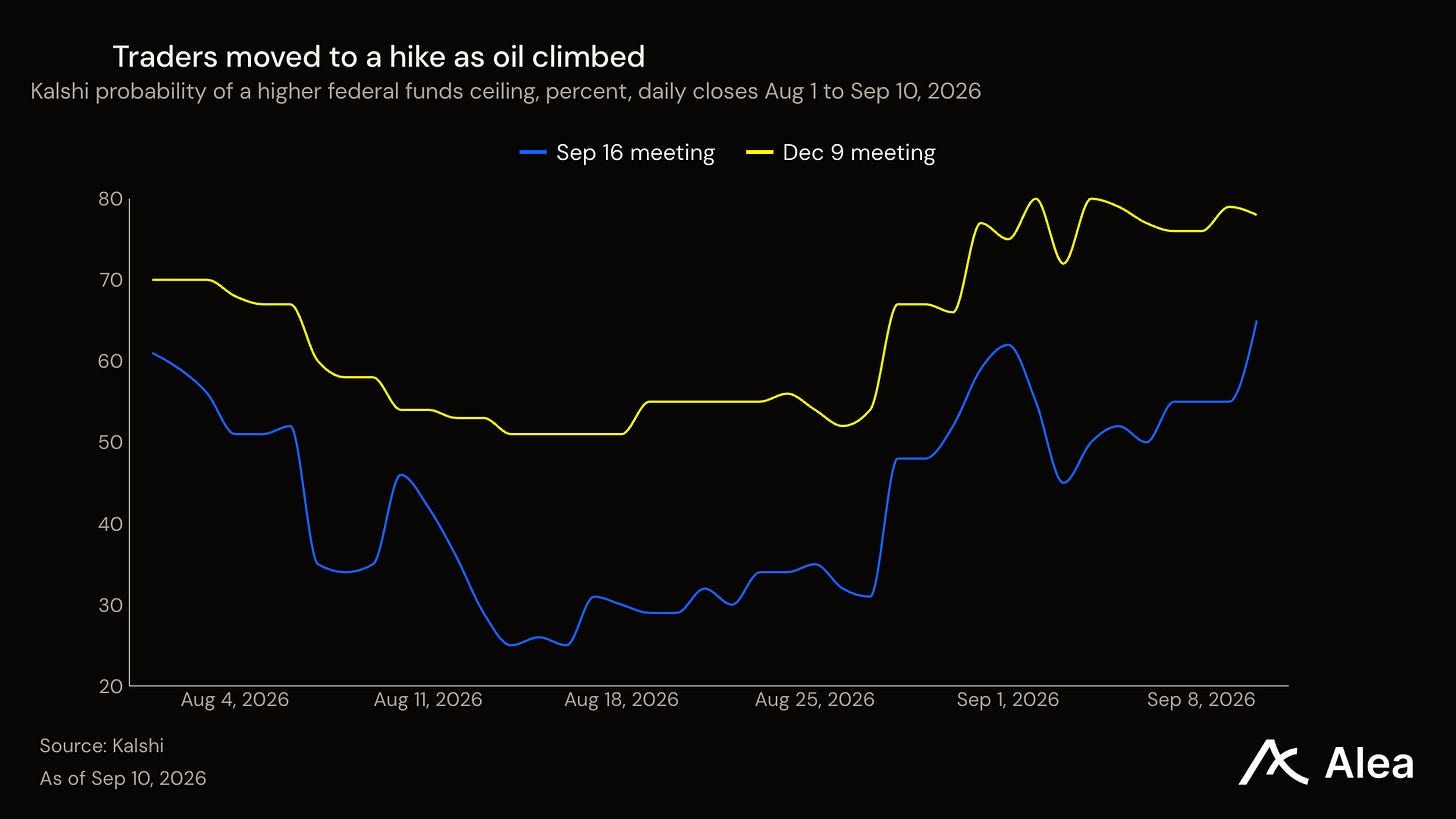
The rate market moved before the data did, and it moved a long way: from 50% to 65% in five sessions, the highest the contract has ever closed.
Cross Asset Market
Majors. WTI +12.0%, ETH −0.76%, gold −1.5%, Nasdaq 100 −1.6%, S&P 500 −1.6%, BTC −3.91%.
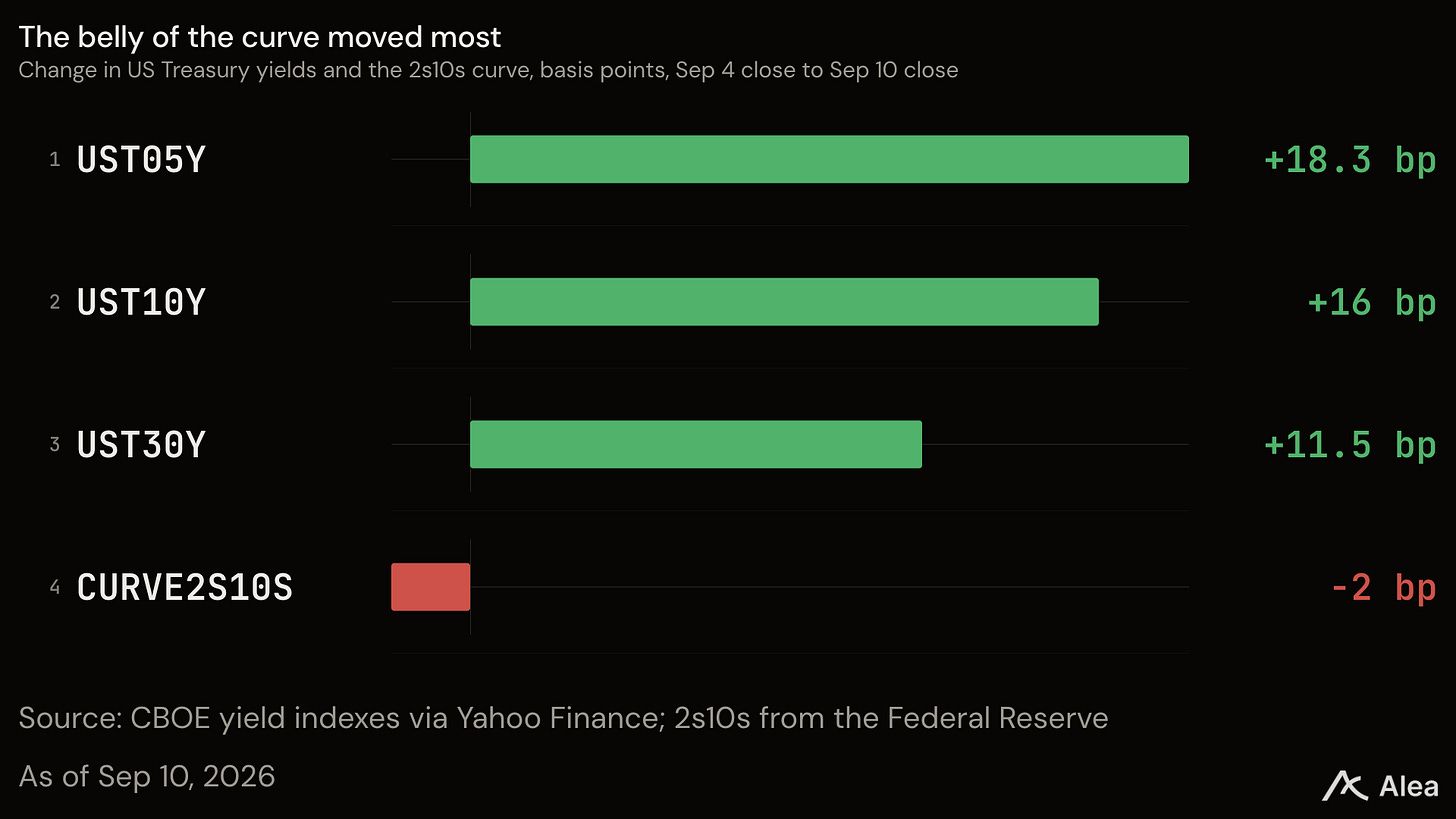
Rates and dollar. 5-year +18 bps, 10-year +16 bps, 30-year +12 bps, 2s10s −2 bps, dollar index −0.07%.
Breadth. Crypto, 63 of 81 beat BTC. Equities, 76 of 503 rose. Commodities, 10 of 18 rose.
Positioning. ETH perpetual contracts +4.9%, BTC −0.3%. Funding halved. BTC long liquidations +30%, shorts −75%.
The S&P 500 closed at 7,591.70, −1.6% from the Sep 4 close and the fifth-worst of 46 matched windows in the past year. Gold settled at $4,364.50, −1.5% from the Sep 4 settlement, ordinary in size beside a 12% oil move. BTC closed at $76,555, −3.91% from the Sep 4 close and behind 63 of the 81 non-stablecoin majors in the top 100. Crude was the only one of the six majors that rose, and it rose alone from Tuesday onward.
Last Week’s View
Last Sunday’s Flow Brief argued that the inflation backdrop depended on oil holding its gain beyond one strong week. The persistence arrived inside seven days, and Friday’s consumer price report confirmed it reached the shelf. Going forward, it is no longer whether oil persists, but about how the Fed answers.
Macro
The Bureau of Labor Statistics reported Friday at 8:30am ET that consumer prices rose +0.4% in Aug, against +0.1% in Jul. Gasoline rose 3.9% and accounted for more than a third of the monthly increase; the energy index rose 2.1% after falling in Jul. Core prices, which strip food and energy, rose +0.3% against +0.2%. The annual rate held at 3.4%.
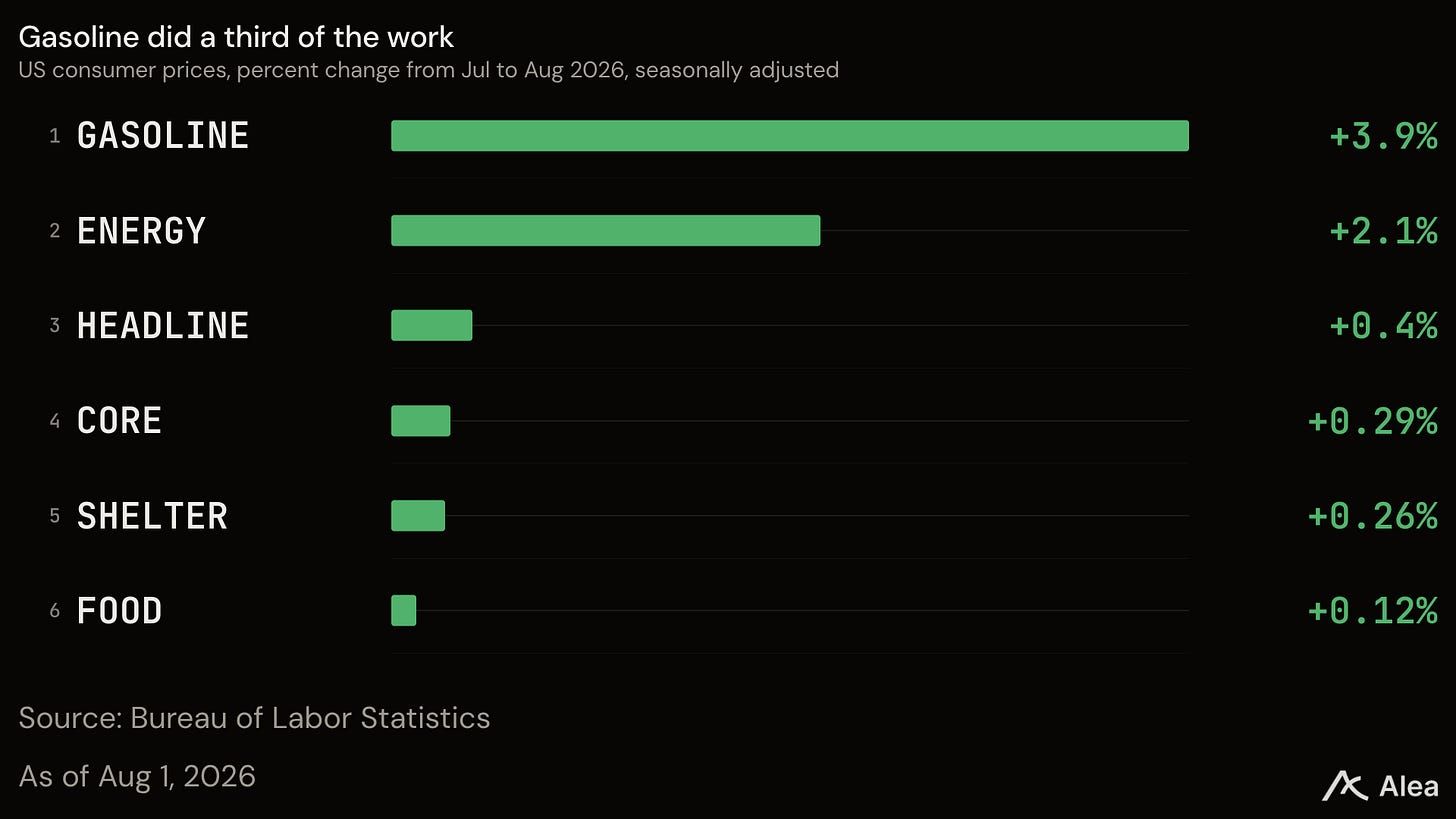
The market had already priced it. Going into the release Kalshi’s Aug CPI ladder put 49% on a +0.4% month and 40% on a 3.4% annual rate, and both landed. A crowd that reads an oil shock correctly a day early is a crowd worth watching on the Fed as well.
Treasury yields rose across the curve, and the middle moved most. The 5-year added 18 basis points to 4.73%, the 10-year 16 to 4.94%, and the 30-year 12 to 5.36%, its highest close in the ten-year record. Only two daily closes in the past decade left the 10-year higher, the most recent in Oct 2023. The 2s10s curve flattened 2 basis points to 39.
The 10-year inflation breakeven rose 5 basis points, so roughly a third of the nominal move was higher inflation compensation and the rest a higher real yield. On Kalshi, the contract on a higher federal funds target ceiling after the Sep 16 meeting moved from 50 cents to 65 cents across the week, on a one-cent spread with 415.5K contracts open. Odds of a cut stayed near zero all week. The dollar did not follow and the dollar index finished at 99.09, −0.07% on the week.
Crypto
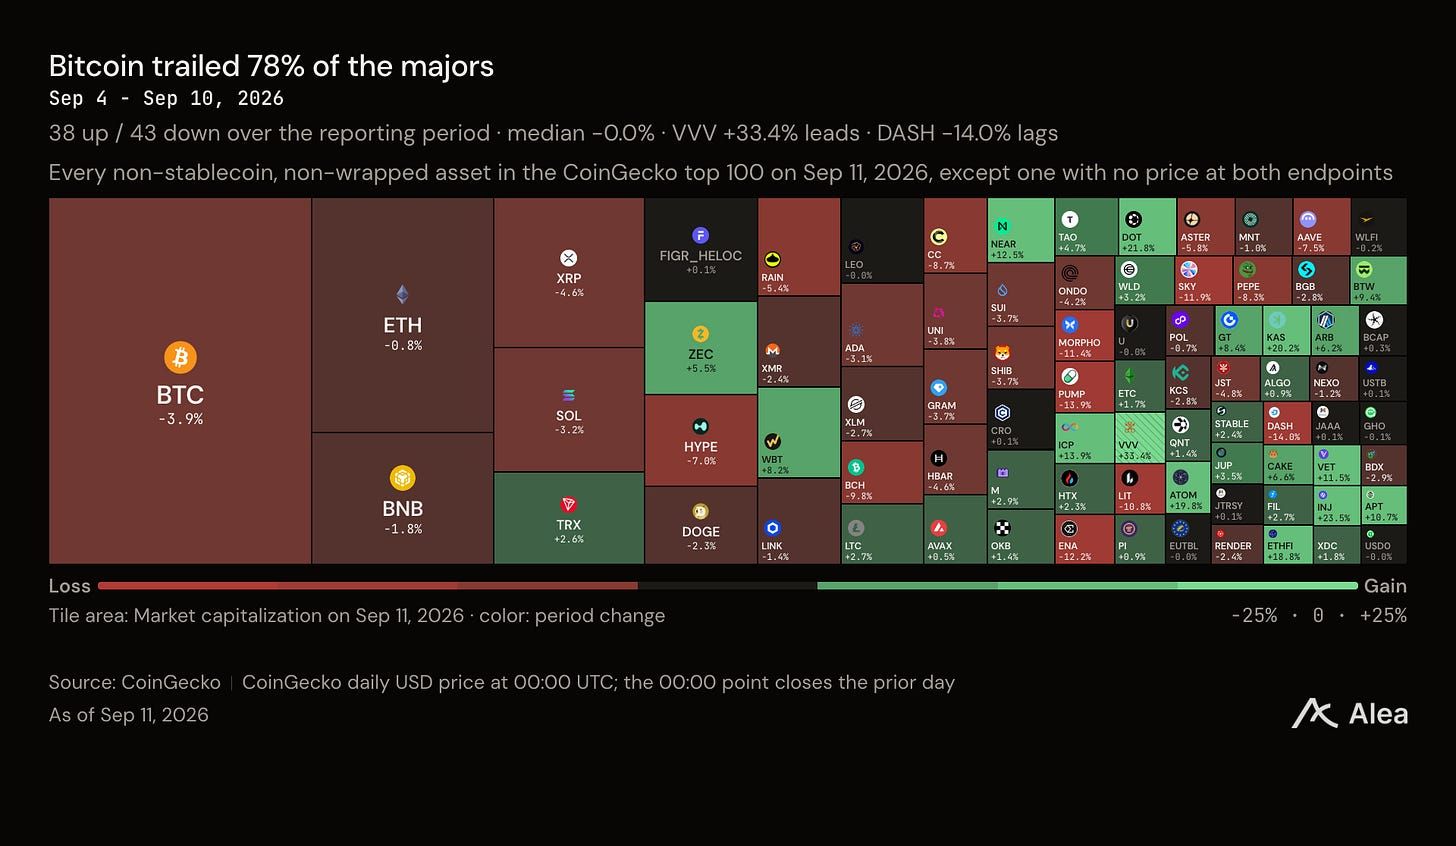
BTC lagged the market it usually leads. BTC closed Thursday near $76,555, down −3.91% on the week. ETH lost −0.76%. 63 of the 81 non-stablecoin assets in the top 100 finished ahead of BTC, and the median one was flat at −0.04%.
US spot BTC funds redeemed $449.5M over the period’s three US trading sessions, and $282.7M of that landed on Thursday. Monday was Labor Day. Measured against the past year, that is an ordinary outflow rather than a rout: it ranks in the bottom quarter of three-session runs, and the heaviest reached −$1.6B. The previous twenty sessions still delivered +$3.19B of net subscriptions. ETH funds lost $19.5M over the same three days.
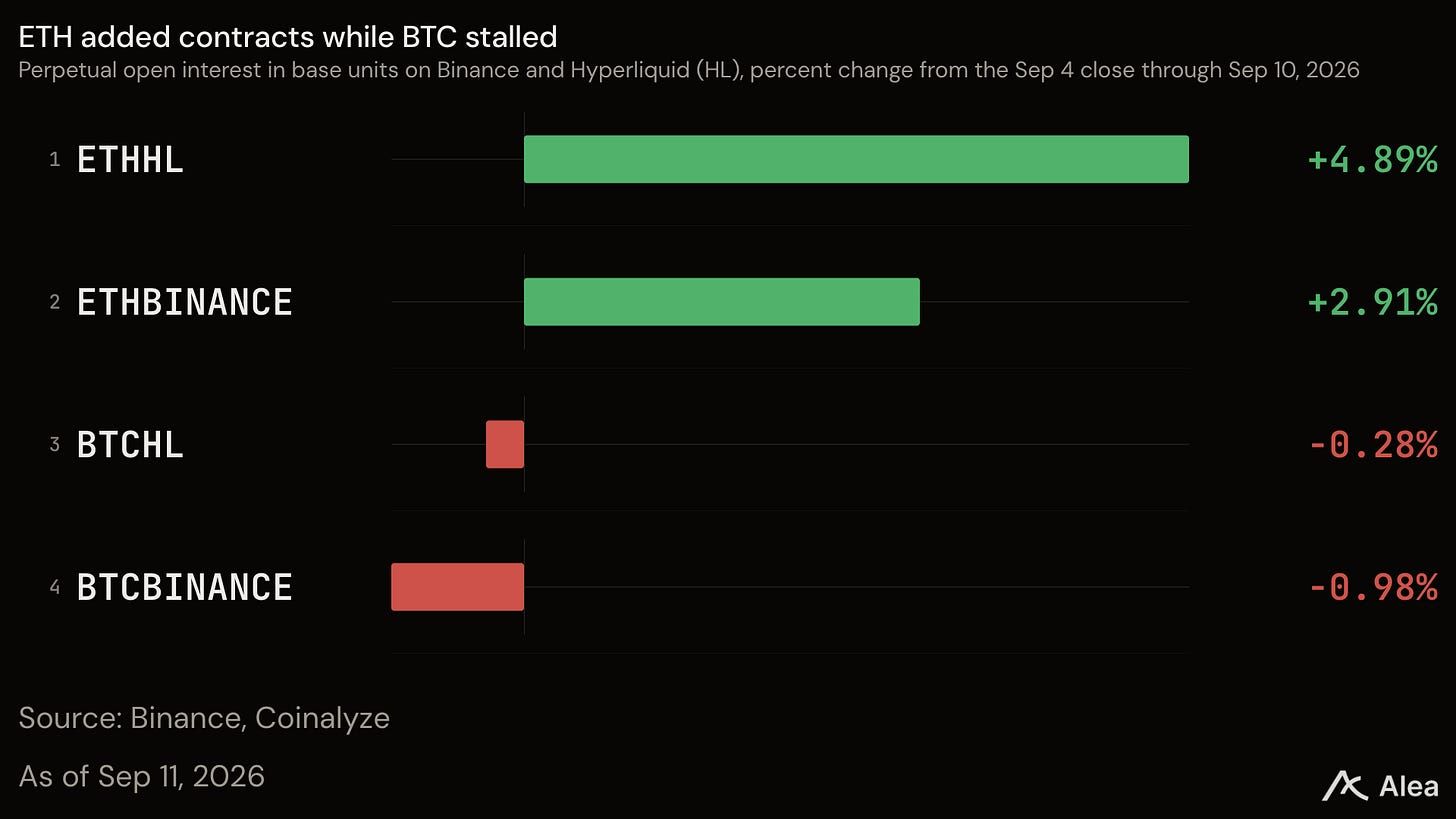
Perpetual positioning rotated instead of leaving. Contract exposure in ETH rose +4.9% on Hyperliquid and +2.9% on Binance, while BTC contracts fell −0.3% and −1.0%. Dollar open interest in BTC fell about 5%, and almost all of that was the lower price rather than fewer contracts.
Funding paid halved. Binance BTC longs paid 0.079% across the week’s eighteen settlements, against 0.147% the week before, and 24 of Hyperliquid’s 144 hourly rates turned negative, against one a week earlier. Binance’s realized liquidations describe the same week from the other side: long liquidations in BTC rose +30% to $92.8M while short liquidations fell −75% to $34.7M. The total fell 38%, which looks calm until you separate the two sides. Stablecoin supply barely moved, down $0.5B to $309.9B, and still $4.7B above a month ago. The dollars stayed on chain.
Equities
Only 76 of the S&P 500’s 503 members rose. Across the 46 comparable Friday-to-Thursday windows of the past year, none was narrower. The median member fell −2.41% while the index lost −1.64%, because the largest technology names carried the average. Energy was the only sector to gain, at +1.36%; healthcare lost −3.38%, materials −3.20%, and industrials −2.69%.
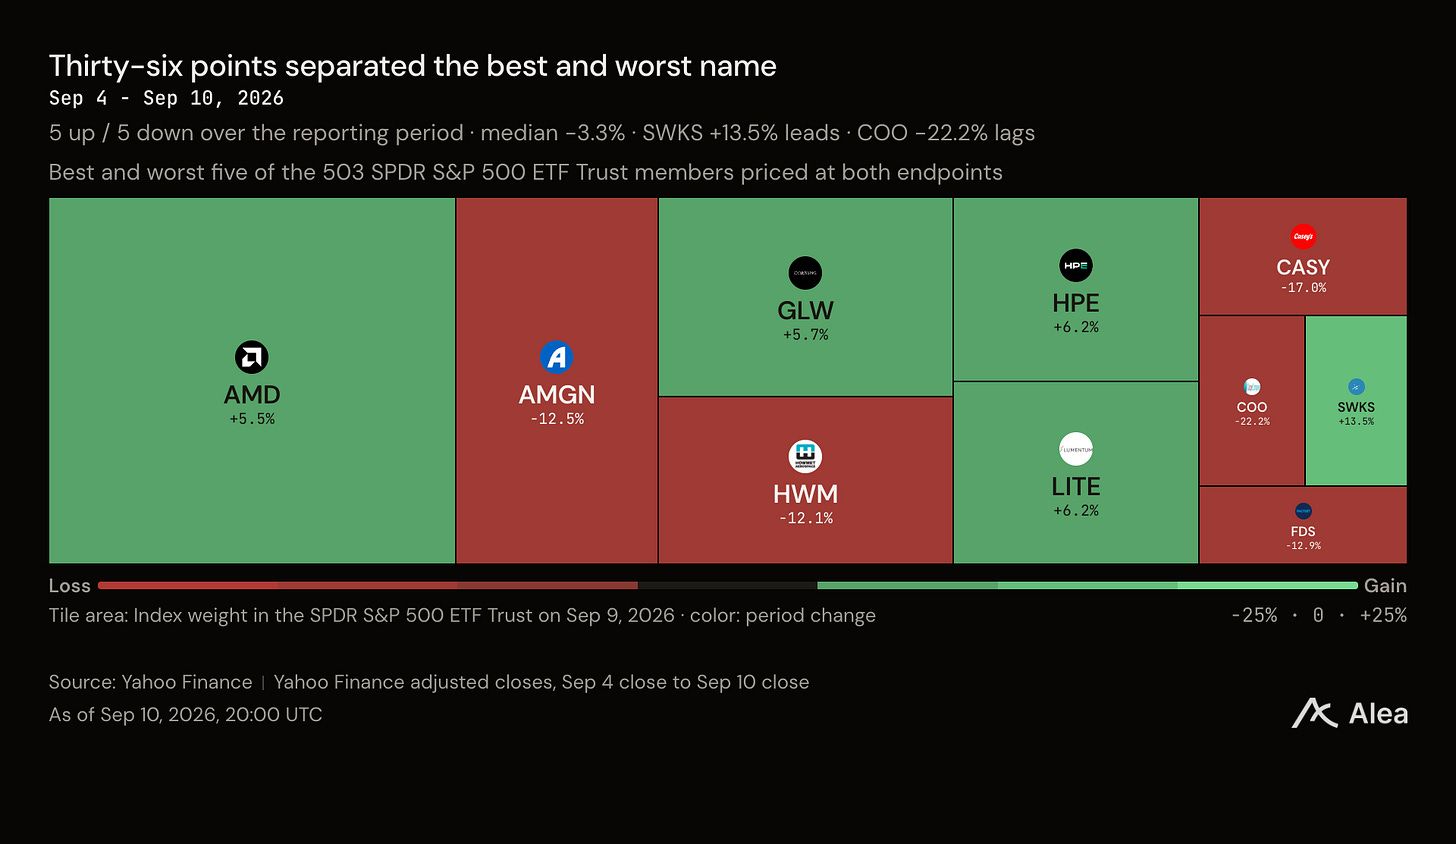
Thirty-six percentage points separated Skyworks Solutions at +13.5% from Cooper Companies at −22.2%. Semiconductors were the exception inside a weak market: Advanced Micro Devices added +5.5% and Qualcomm +4.8%. Small caps, measured by the Russell 2000, fell −2.85%, their second-worst week of the year, which is what a higher discount rate does to companies that borrow at floating rates. Europe did not escape the move: the DAX fell −2.63% and the FTSE 100 −2.05%.
Commodities
Ten of eighteen front-month contracts rose, and the median gain was +1.01%. Crude, Brent, heating oil, and gasoline took the top four places. Palladium fell −7.8%, natural gas −4.7%, silver −2.7%, copper −2.0%, and gold −1.5%.
The sequence was geopolitical, and every step carries a date. On Sep 8 Houthi forces struck Saudi energy sites. NPR reported fires at the sites and 73 people wounded. Iran’s Revolutionary Guard warned tanker crews at Kuwaiti and Bahraini ports to leave their ships after US strikes on five Iranian tankers. On Sep 9 Iran reported attacking ten vessels near the Strait of Hormuz. Crude rose +6.7% on Thursday alone. For scale, WTI still sits 9.3% below its Apr 7 high of $112.95.
The Week Ahead
Wednesday, Sep 16, 2:00pm ET. The Federal Reserve’s decision and a new Summary of Economic Projections, with a press conference at 2:30pm. Kalshi puts a rise at 65%.
Thursday and Friday, Sep 17-18. The Bank of Japan meets, with its decision on Friday.
Through the week. Whether crude holds above $100 decides if the Sep print was a spike or a shelf.
Market Assessment
The best-supported reading is an oil-driven inflation impulse that limits the Fed’s room. A growth scare would have bid up gold and widened credit. Five measurements point that way: energy alone led the commodity board, gasoline supplied more than a third of the monthly CPI increase, inflation compensation supplied roughly a third of the 10-year’s rise, Sep hike odds gained 15 percentage points, and gold and credit stayed quiet while equities fell.
The strongest competing explanation is a term-premium story, in which long-end supply and fiscal worry lift yields regardless of oil. The curve argues against it. A term-premium move lifts the 30-year most; this week the 5-year moved most and the long end least.
Important Links
Aug consumer prices, Bureau of Labor Statistics
Aug producer prices, Bureau of Labor Statistics
Iran’s warning to tanker crews at Kuwaiti and Bahraini ports
Market data: Yahoo Finance, CoinGecko, Kalshi, Coinalyze, DefiLlama

Who buys when the fund bid steps back? Pulse, Alea’s flagship report, took up that question on Sep 6 in “The Paradox of the Next Buyer”. It works through the business economics behind a move, the explanations that compete with the obvious one, and the evidence that would change the view. Read the latest Pulse.
Building a protocol? Give institutional readers a reason to keep following your work. Alea connects a researched investment case with a maintained data room, live analytics, and continuing intelligence, so readers can understand the business and track its progress. Explore our research and data rooms.