Between October 1, 2025 and August 26, 2026 the four listed memory and storage makers returned 511% as an equal-weight basket. Over the same eleven months the five largest hyperscalers returned negative 2.6%. Nvidia returned 12.1%.
That is the AI trade of the last eleven months. It did not pay the model builders or the cloud operators. It paid the companies that sell them memory.
What changed
Since last October the returns of the AI trade have gone to the supply side: the memory complex. Sandisk now trades at 12.4 times its October 1 price. Micron returned 416%, Western Digital 260%, and Seagate 231%. The iShares Semiconductor ETF returned 87% over the same window. Seagate, the smallest gainer of the four, returned 2.7 times the index’s gain. Sandisk returned 13 times it.
Then, in one week of June, the whole thing stopped.
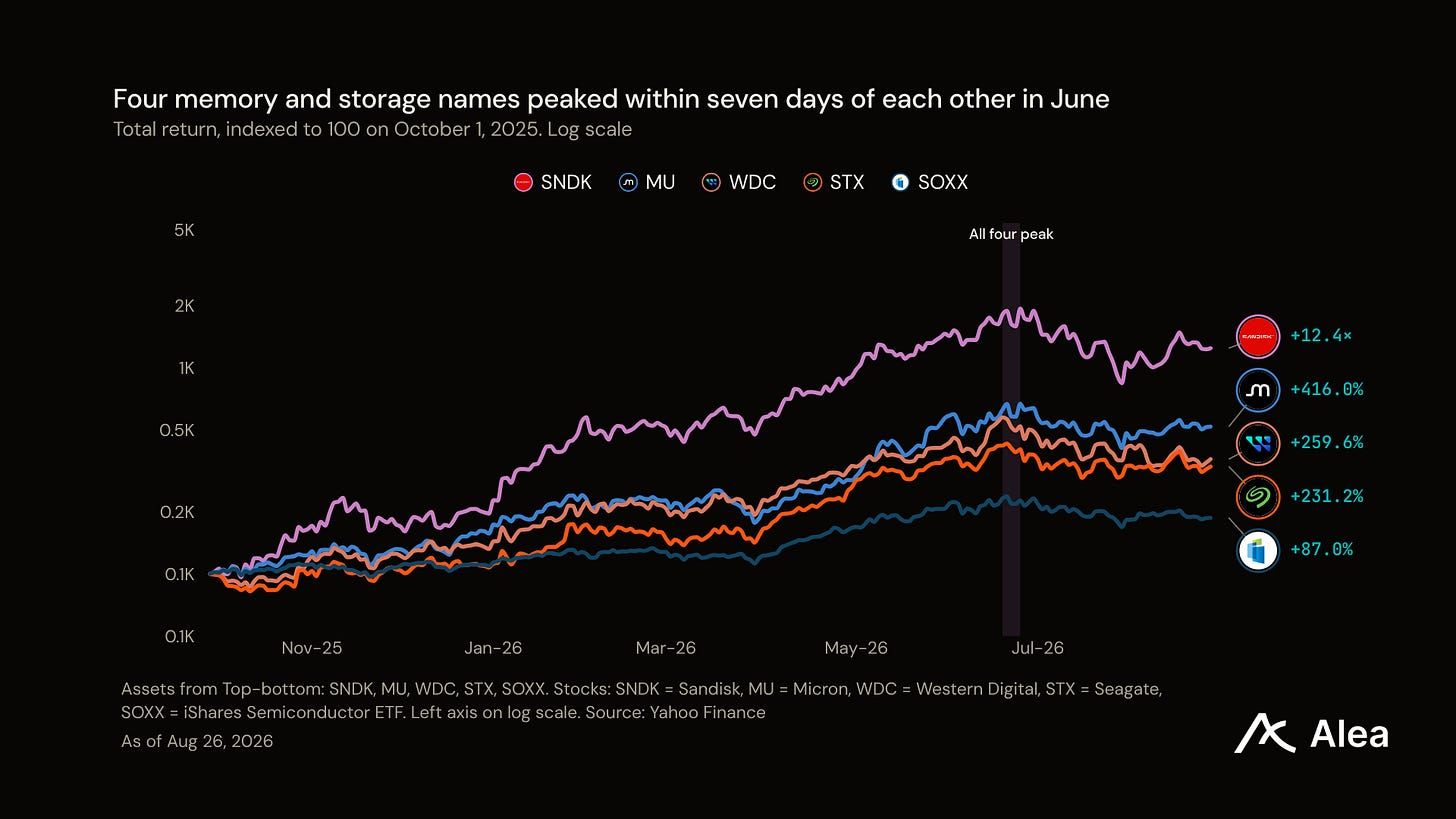
Western Digital topped on June 18. Seagate on June 22. Micron and Sandisk on June 25. Four companies with different product mixes, different customers, and different fiscal calendars stopped rising inside seven days of each other, and the chip index topped on June 22 with them. Each of the four now sits between 23% and 37% below that high.
One position wearing four tickers
Across October 1 to June 17, the average pairwise correlation of daily returns among Micron, Western Digital, Seagate and Sandisk was 0.72. Through the drawdown since June 18 it rose to 0.80, with no pair below 0.72. Correlation to the semiconductor index rose the same way: Sandisk from 0.62 to 0.86, Micron from 0.80 to 0.88.
Compare the hyperscalers over the same two windows: 0.31 before, 0.36 after, with pairs as low as 0.02. They are five separate businesses that share a theme.
This is the part that changes position sizing rather than opinion. Take a book holding all four memory names at 3% each. If the four were independent, that basket would carry 6% of single-name volatility. If they were the same stock, it would carry 12%. At the measured 0.80 it carries 11.1%, far nearer the single-position case than the independent one.
The index has not recovered
The semiconductor index closed August 26 at $515.40 against a June 22 peak of $655.01. It last traded below the current level on May 19, so nine weeks of decline have erased roughly three months of gains.
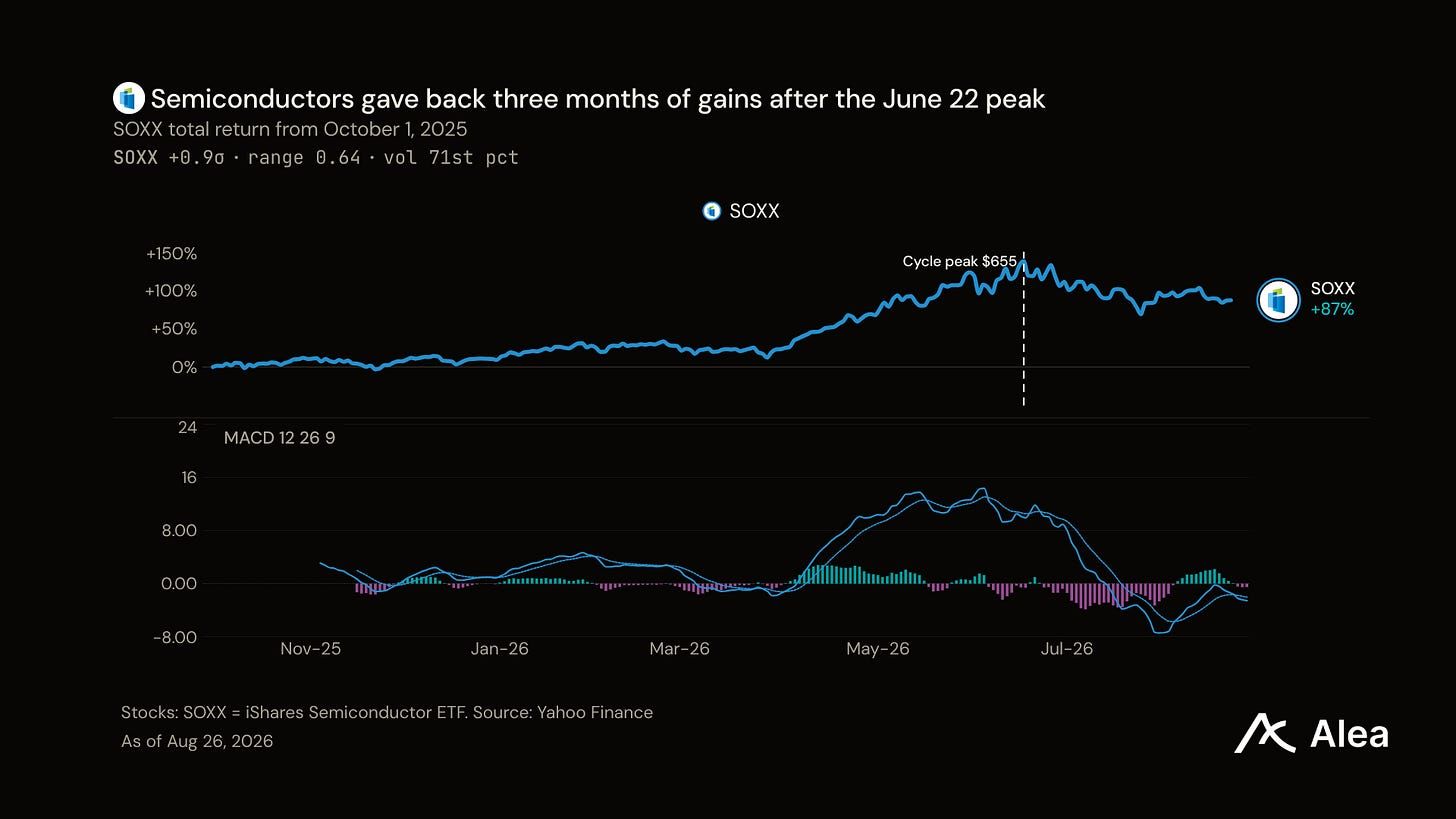
Momentum has not come back in that time. The MACD line has stayed negative on 31 of the 47 sessions since June 22.
There was one real improvement, thirteen sessions of positive histogram between August 5 and August 21, and it has already rolled over: the histogram closed August 26 at negative 1.44 and the line at negative 7.06.
Hold the size of the prior move in view while reading that. The index is still 87% higher across the eleven months. A 21% give-back inside a move that large is an ordinary correction.
What the flat hyperscaler number hides
The hyperscaler group returned negative 2.6% over the eleven months, and no constituent experienced that. Alphabet returned 39.9% and Amazon 18.0%. Meta fell 19.5% and Oracle 47.9%. The spread from best to worst is 88 percentage points, and the group average is the arithmetic of that spread rather than a common outcome.
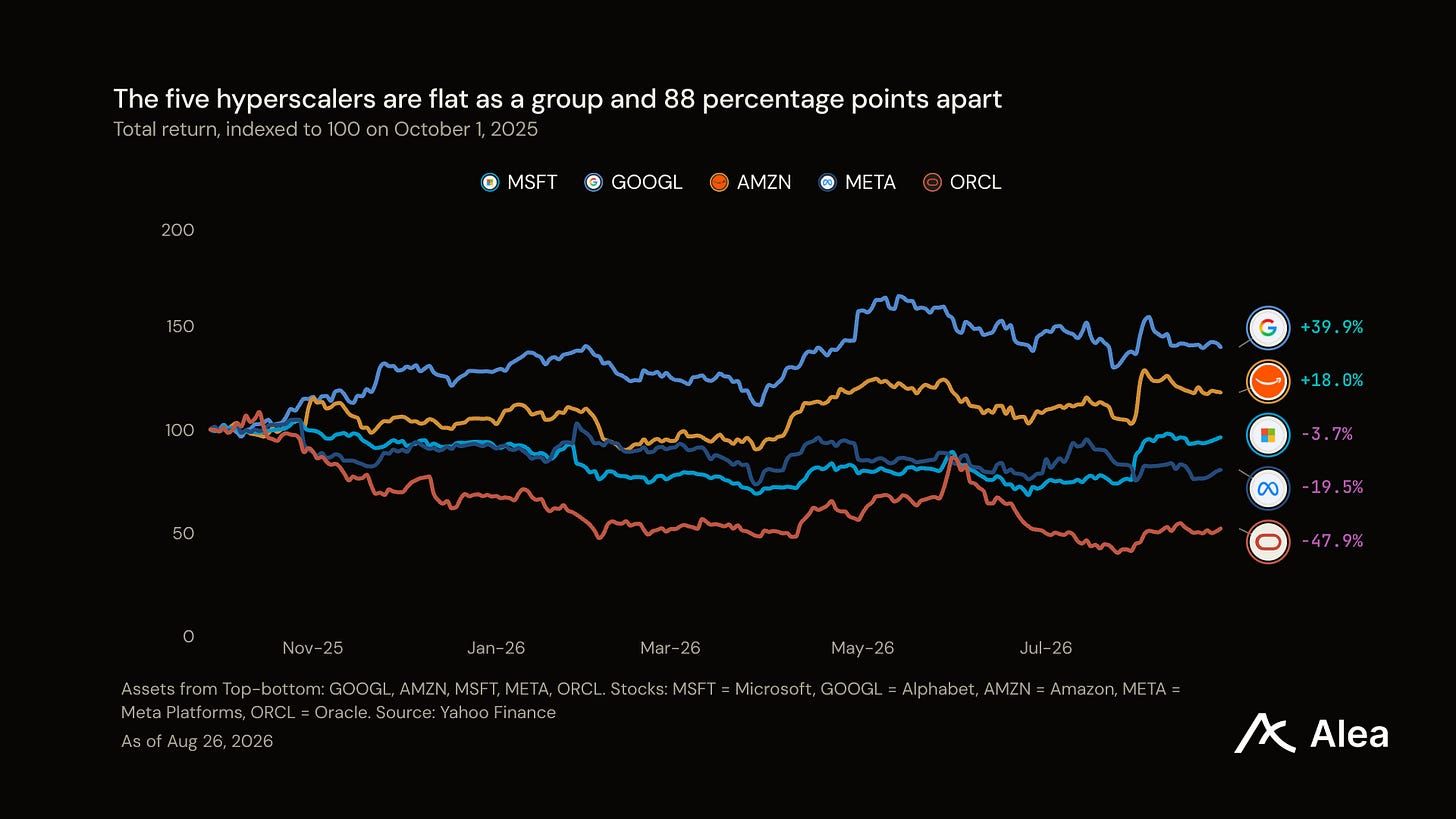
Oracle carries most of the negative sign. Take it out and the remaining four returned 8.7%, which reads as a weak eleven months rather than a stalled one. Either way the comparison holds: the companies buying the compute earned single digits while the companies selling them the memory earned 511%.
The 0.36 correlation is the useful detail here. Prices have separated these five companies over eleven months, which is what happens when a theme resolves into five sets of accounts. Inside the memory complex the correlation moved the other way.
What would confirm this and what would break it
The memory cohort’s next rally is the test. Each of the four sits 23% to 37% below a June peak set within seven days of the others. A rally that stalls below those June levels while the semiconductor index stays under $655.01 confirms that June ended the leadership. A cohort that reclaims them restores it, and the correlation reading tells you it will do so together or not at all.
Two things would change the read before that. A memory name that decouples from the other three, in either direction, would mean the group has stopped trading as one order book. A close below $515.40 on the index would push the give-back past three months of gains.
Everything above is measured from daily adjusted closes, October 1, 2025 to August 26, 2026, US listings only. Cohort figures are unweighted averages of the constituents named. MACD uses the standard 12, 26, 9 parameterization. Correlations are of daily log returns.

Read our latest Weekly Pulse, Alea’s flagship report covering macro, crypto, equities, and commodities. The August 29 edition examines whether fresh buyers can sustain the rally after the short squeeze.
Alea combines independent research with live protocol data to help you evaluate opportunities and understand their risks before committing capital.
Crypto teams can benchmark performance and give investors and partners a clearer view of their protocol’s economics.
Institutions can conduct due diligence with structured research and Protocol Data Rooms.
Traders can follow flows and catalysts across markets.
Investors can test an investment thesis against fundamentals and valuation.