Capitalizing on Relative Asset Performance
Crypto is a highly volatile asset class where the overall returns of a portfolio are often highly correlated with the overall market led by $BTC price movements. The nature of this market makes it complicated for investors to build out diversified portfolios that can dampen the effect of volatility. However, this also creates opportunities to profit from relative outperformance over certain time intervals. As catalysts present and news unfold, the market starts to price in future expectations, causing certain assets to outperform while others lag behind them. This is why pairs trading can be a powerful tool for us to extract value out of the inefficiencies of an emergent market like crypto.
Pairs trading strategies focus on the relative performance of assets, and are often designed to make a profit regardless of market conditions—whether bearish, bullish, or sideways—by exploiting the differential price action between selected assets. Portfolios employing these strategies are typically built through long / short positions on two or more assets, usually aiming for market neutrality. However, they can also be fine-tuned to reflect the investor directional bias, which is highly effective for capitalizing on news or so-called “narratives trading”.
Most strategies targeting market neutrality can be implemented through systematic and statistical methods that rely on mathematical models to identify and act on temporary price deviations between assets that typically move in tandem. Alternatively, they can also be guided by more discretionary or fundamental factors, known as “narratives trading”. Therefore, Long / Short portfolios are tailored to reflect an investor’s perspective on market dynamics based on catalysts, sector trends, thematic developments, or significant news events.
This series of reports will cover various methodologies for building such portfolios, including pairs trading and long-short strategies. In order to do so, it will discuss the foundational models behind market neutrality, the mechanics of constructing such portfolios, and practical applications of these strategies in crypto, illustrated with real-world examples and use cases.
Key Takeaways
- The report underscores the value of constructing long/short (L/S) portfolios to exploit differences in asset performance over a period of time. These strategies are versatile tools in an investor’s toolbox, applicable with varying degrees of complexity based on your own experience and skills.
- Revisiting the Capital Asset Pricing Model (CAPM) is important for establishing a theoretical foundation for L/S strategies. Key concepts such as beta and the concept of a “market portfolio” are essential for understanding risk and return dynamics.
- After examining the beta dynamics of selected perpetual contracts from 2022 onwards, it is possible to confirm the well-noted fact that cryptocurrency tokens typically exhibit higher betas than the market portfolio, indicating greater volatility relative to the broader market and high sensitivity to changes in market regimes.
- Strategies employed by hedge funds in traditional finance to achieve various levels of market neutrality provide valuable insights that can be applied for constructing L/S portfolios in crypto. These strategies range in complexity from pairs trading and statistical arbitrage to approaches driven by fundamental analysis or news.
- The creation of three distinct L/S strategies showcases how investors could implement narrative-based investment strategies while aiming for different levels of exposure to the market.
- L/S strategies provide a comprehensive framework that enables investors to navigate any market conditions with enhanced precision. These strategies contribute to reduced market risk, more diversification, and improved risk-adjusted returns.
Background
The market, with its endless variables and unpredictable nature, requires a broad, multifaceted approach to be truly understood. Financial markets are inherently complex, characterized by a multitude of factors that influence asset prices and market movements. These factors include economic indicators, corporate or protocol performance, geopolitical events, catalysts, and investor sentiment, among others.
To navigate this complexity, investors and analysts employ a range of methodologies, each with its own focus and assumptions. These methodologies fall broadly into categories like technical analysis, fundamental analysis, quantitative methods, and others such as sentiment analysis or macroeconomic theses.
No single approach provides a panacea; each has its strengths and limitations. Like assembling a puzzle, understanding the market requires piecing together insights from various analytical frameworks. Each of these methods contributes a different lens through which investors can view the market, providing a richer, more nuanced understanding of the opportunities and risks at play. Despite the variety of opinions and methodologies—ranging from technical analysis to fundamental valuation models—each offers a partial view, emphasizing the complexity and unpredictability of markets.
This illustrates the story illustrated in the book “Pairs Trading: Quantitative Methods and Analysis” by Ganapathy Vidyamurthy, where six blind men encounter different parts of an elephant, each drawing unique conclusions about its appearance. Each individual would touch different parts of the elephant and conclude it resembles objects based on the part they encounter (wall, spear, snake, tree, fan, rope) highlighting their partial understanding.
Figure 1: Partial understanding about how the world works.
Source: Pairs Trading, Quantitative Methods and Analysis
The six blind men wished to know what an elephant looked like, but each of them perceived one aspect of
the elephant alone. Even though they were right in their own way, none of them knew what the whole elephant really looked like. This diversity reflects the market’s capacity to accommodate differing, sometimes conflicting, belief systems.
While some investors buy stocks based on information regarding particular companies, others utilize strategies that try to profit based on understanding of the stock market and its behaviors in general. The same happens in crypto, where some investors put a lot of emphasis on fees and revenue while others prefer trading “narratives”. Regardless, pairs trading remains one of the most powerful strategies that investors can use to their advantage in order to capitalize from the relative asset performance of two or more assets.
What is Relative Asset Performance
Strategies designed to capitalize on the relative performance of two or more assets involve a mix of long (buy) and short (sell) positions. An investor will take long positions in assets they believe are undervalued and likely to appreciate in value, and short positions in assets they perceive as overvalued and expected to decline in value.
This is why long/short (L/S) investing is often referred to as a double alpha strategy – the term “alpha” is used here to refer to the outperformance of an investment. In long/short investments, one alpha may come from the long side (the undervalued asset appreciates in value) and the other alpha may come from the short side (the overvalued asset depreciates in value).
A remarkable property of L/S investing is that the investor may be partly wrong in his choice of assets on an absolute basis, but the position may still be profitable, even though both the long and the short positions decline or appreciate in absolute terms. Indeed, what matters is that the long leg outperforms the short leg on a relative basis (or viceversa), aiming to profit from any changes in the spread between these positions.
Figure 2: A trading strategy for all market conditions
Source: Pear Protocol.
Another key feature of L/S strategies is their ability to minimize overall market exposure (a.k.a. “market neutrality”), allowing investors to potentially profit under various market conditions—whether bearish, bullish, or sideways. It is important to note, however, that not all L/S strategies are market neutral. This flexibility allows investors to tailor their portfolio’s exposure to the desired level of market risk.
To understand how these strategies work and their differences, it will be necessary to discuss several key terms and concepts.
Figure 3: Several key terms and concepts to understand L/S strategies.
Source: Revelo Intel.
A good starting point is the Capital Asset Pricing Model (CAPM). Although this report will not go into great detail about CAPM or judge its practical use, it does introduce important ideas such as beta and market portfolio. These concepts are particularly valuable in practice, especially as the concept of market neutrality plays a crucial role in all the L/S strategies that this series of reports will explore.
Understanding Investment Risk and Returns: From Basics to CAPM
Risk Decomposition: Systematic vs Non-Systematic
In finance, risk arises from the deviation of actual returns from expected returns and this deviation can have any number of causes, which can be classified into two categories:
- Systematic risk
- Non-systematic risk
Systematic risk, also known as non-diversifiable or market risk, is the risk that cannot be avoided and is inherent in the overall market. It is non-diversifiable because it includes risk factors that are innate within the market and affect the market as a whole. Examples of factors that constitute systematic risk include interest rates, inflation, economic cycles, political uncertainty, and widespread natural disasters. These events affect the entire market, and there is no way to avoid their effect. All risky investments bear some exposure to this risk (market risk).
Non-systematic risk is risk that is local or limited to a particular asset or industry that need not affect assets outside of that asset class. Examples of non-systematic risk could include the failure of a drug trial, major oil discoveries, or an airline crash. All these events will directly affect their respective companies and possibly industries, but have no effect on assets that are far removed from these industries. Investors are capable of avoiding non-systematic risk through diversification by forming a portfolio of assets that are not highly correlated with one another.
In general, it is possible to decompose risk such that:
Total variance = Systematic variance + Non-systematic variance
Figure 4: Risk Decomposition
Source: Corporate Finance Institute.
In constructing a portfolio, it is important to understand the concept of correlation and how less-than-perfect correlation can diversify the risk of a portfolio. As a consequence, the risk of an asset held alone may be greater than the risk of that same asset when it is part of a portfolio.
Diversification significantly reduces, or in some cases, completely neutralizes nonsystematic risk due to two key factors: (1) each investment constitutes only a small fraction of a diversified portfolio, and (2) the firm-specific actions affecting the prices of individual assets can have varying impacts (both positive and negative) across different periods. In large portfolios, these risks tend to offset each other, averaging out to zero, thus having minimal effect on the portfolio’s overall value. Conversely, market-wide trends generally influence most, if not all, investments in the same direction, although the degree of impact can vary among assets. While diversification does not eliminate market risk, spreading investments across various industries can mitigate its effects.
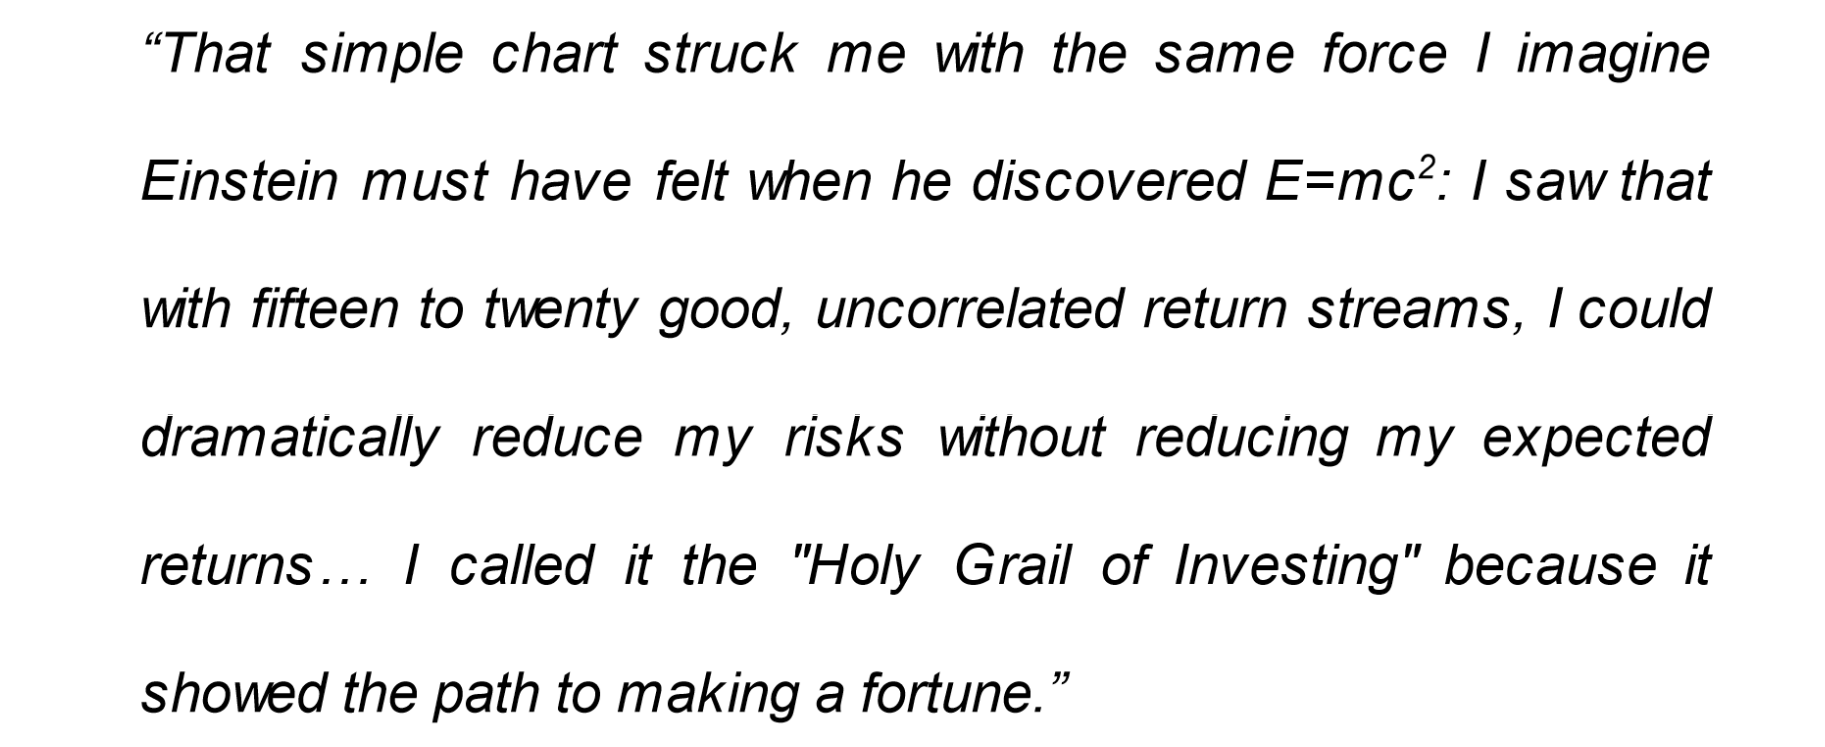
Ray Dalio, founder of Bridgewater Associates, one of the world’s largest hedge funds, referred to diversification as the “Holy Grail of Investing” in his book “Principles.” To illustrate this concept, he included the following chart and shared his insights on it:
Figure 5: Diversification – The Holy Grail of Investing.
Source: Ray Dalio’s “Principles”.
The notion that diversification reduces an investor’s risk exposure is widely accepted. However, financial risk and return models go deeper, suggesting that the marginal investor, who influences investment pricing, is typically well-diversified. As a result, only the risks perceived by such an investor are reflected in market prices. This concept is based on the premise that an undiversified investor perceives higher risks in an investment compared to a diversified investor, primarily because non-systematic risks affect the former but not the latter.
That being said, most risk and return models developed in investments and finance agree on the first two steps of the measurement process: (1) risk comes from the distribution of actual returns around the expected return, (2) risk should be measured from the perspective of a marginal investor who is well diversified. However, the models part ways on how to measure the non-diversifiable or market risk.
The four basic models that approach the issue of measuring market risk are the Capital Asset Pricing Model (CAPM), the Arbitrage Pricing Model (APM), the multi-factor models, and the regression models.
Return Generating Models
A return-generating model is a model that can provide an estimate of the expected return of an asset given certain parameters. If systematic risk is the only relevant parameter for return, then the return-generating model will estimate the expected return for any asset given the level of systematic risk.
As with any model, the quality of estimates of expected returns will depend on the quality of input estimates and the accuracy of the model. The most general form of a return-generating model is a multi-factor model.
A multi-factor model allows more than one variable to be considered in estimating returns and can be built using different kinds of factors, such as macroeconomic, fundamental, and statistical factors.
A general return-generating model like this is expressed as:
The coefficients, ![]() , are called factor weights or factor loadings associated with each factor. The left-hand side of the model has excess return, or return over the risk-free rate. The right-hand side provides the risk factors that would generate the return or premium required to assume that risk. The E(Rm) factor is separated by the other as it represents the market return. All models contain return on the market portfolio as a key factor.
, are called factor weights or factor loadings associated with each factor. The left-hand side of the model has excess return, or return over the risk-free rate. The right-hand side provides the risk factors that would generate the return or premium required to assume that risk. The E(Rm) factor is separated by the other as it represents the market return. All models contain return on the market portfolio as a key factor.
Defining the Market: the role of proxy indices
Theoretically, the “market” includes all risky assets or anything that has value, which includes stocks, bonds, real estate, and even human capital. Ideally, it would include as many assets as possible, but it’s impractical to incorporate every single risky asset into one portfolio. Furthermore, not all assets are tradable, and not every tradable asset is suitable for investment.
For practicality and convenience, the definition of “market” is often much more specific. A local or regional stock market index usually serves as a proxy due to the high volume of trading and its visibility to local investors. For instance, in the United States, the S&P 500 Index is commonly used to represent the market. This index comprises 500 leading companies and reflects about 80% of the available market capitalization in the U.S., with each company weighted according to its market cap relative to the total. In crypto, most investors often use $BTC as the benchmark.
The Capital Asset Pricing Model (CAPM)
The simplest form of a return-generating model is a single-factor linear model, also known as a single-index model or Capital Asset Pricing Model (CAPM), in which only one factor is considered.
The CAPM is a simple risk and return model that has been in use longer than the others and is still the standard in most real-world analyses. Like any model, the CAPM has its limitations and is not always effective in accurately modeling asset returns. Nonetheless, it offers a straightforward framework that enables us to estimate returns and assess performance. While newer models present alternative approaches to CAPM, they are not universally superior in every scenario or consistently practical for real-world applications.
The impact that the model has made in the area of finance is readily evident in the prevalent use of the word beta. Along with the idea of beta, CAPM also served to formalize the notion of a market portfolio. A market portfolio in CAPM terms is a portfolio of assets that acts as a proxy for the market.
The model provides a linear expected return-beta relationship that precisely determines the expected return given the beta of an asset. In doing so, it makes the transition from total risk to systematic risk, the primary determinant of expected return. So, the CAPM asserts that the expected returns of assets vary only by their systematic risk as measured by beta, measured relative to a market portfolio:
Where ![]() is the expected return on the asset i (variable),
is the expected return on the asset i (variable), ![]() is the risk-free rate (constant),
is the risk-free rate (constant), ![]() is the expected return on the market portfolio (variable, source of market risk), and
is the expected return on the market portfolio (variable, source of market risk), and ![]() is the systematic risk factor of asset i (constant).
is the systematic risk factor of asset i (constant).
If we shift from expected returns to realized returns, the return on an asset in the CAPM framework can be separated into two components. One is the market or systematic component, and the other is the residual or non-systematic component. The formula showing the relationship that achieves this separation of returns is given as:
Here![]() is the residual return of asset i (variable, unpredictable random error which average zero, source of non-systematic risk).
is the residual return of asset i (variable, unpredictable random error which average zero, source of non-systematic risk).
Beta: Measuring Market Risk
Systematic risk can be measured using beta:
As shown above, beta is a measure of how sensitive an asset’s return is to the market as a whole and is calculated as the covariance of the return on asset i and the return on the market divided by the variance of the market return. In other words, beta captures an asset’s systematic risk, or the portion of an asset’s risk that cannot be eliminated by diversification.
Put simply, a positive value for beta indicates that the return of an asset moves in the same direction of the market, whereas a negative value for beta indicates that the return of an asset moves in the opposite direction of the market. For example, if an asset’s beta is 2, then a sudden 1% increase in the price of the market portfolio would be expected to cause a 2% increase in the asset’s price.
Because the covariance of the market portfolio with itself is its variance, the beta of the market portfolio—and by extension, the average asset in it, is 1. Assets that are riskier than average will have betas that exceed 1, and assets that are safer than average will have betas that are lower than 1. The riskless asset will have a beta of zero. A beta of zero indicates that the asset’s return has no correlation with movements in the market. For reference, most stocks tend to be highly correlated with the market and, as a result, finding assets that have a consistently negative beta because of the market’s broad effects on all assets is unusual.
Finally, it is also possible to break up the total variance of an asset into systematic and nonsystematic variances using the CAPM variance equation:
Where ![]() is the total variance of asset i,
is the total variance of asset i, ![]() is the systematic variance of asset i, and
is the systematic variance of asset i, and ![]() is the non-systematic variance of asset i.
is the non-systematic variance of asset i.
Because non-systematic risk is zero for well-diversified portfolios, such as the market portfolio, the total risk of a market portfolio and other similar portfolios is only systematic risk, which is ![]()
The Security Market Line
The Security Market Line is a graphical representation of the CAPM. As shown earlier, the beta of the market is 1 and the market earns an expected return of ![]() Using this line, it is possible to calculate the expected return of an asset. The slope of the line equals
Using this line, it is possible to calculate the expected return of an asset. The slope of the line equals ![]()
Figure 6: The Security Market Line
Source: CFA Institute.
Returns and Beta in the Context of a Portfolio
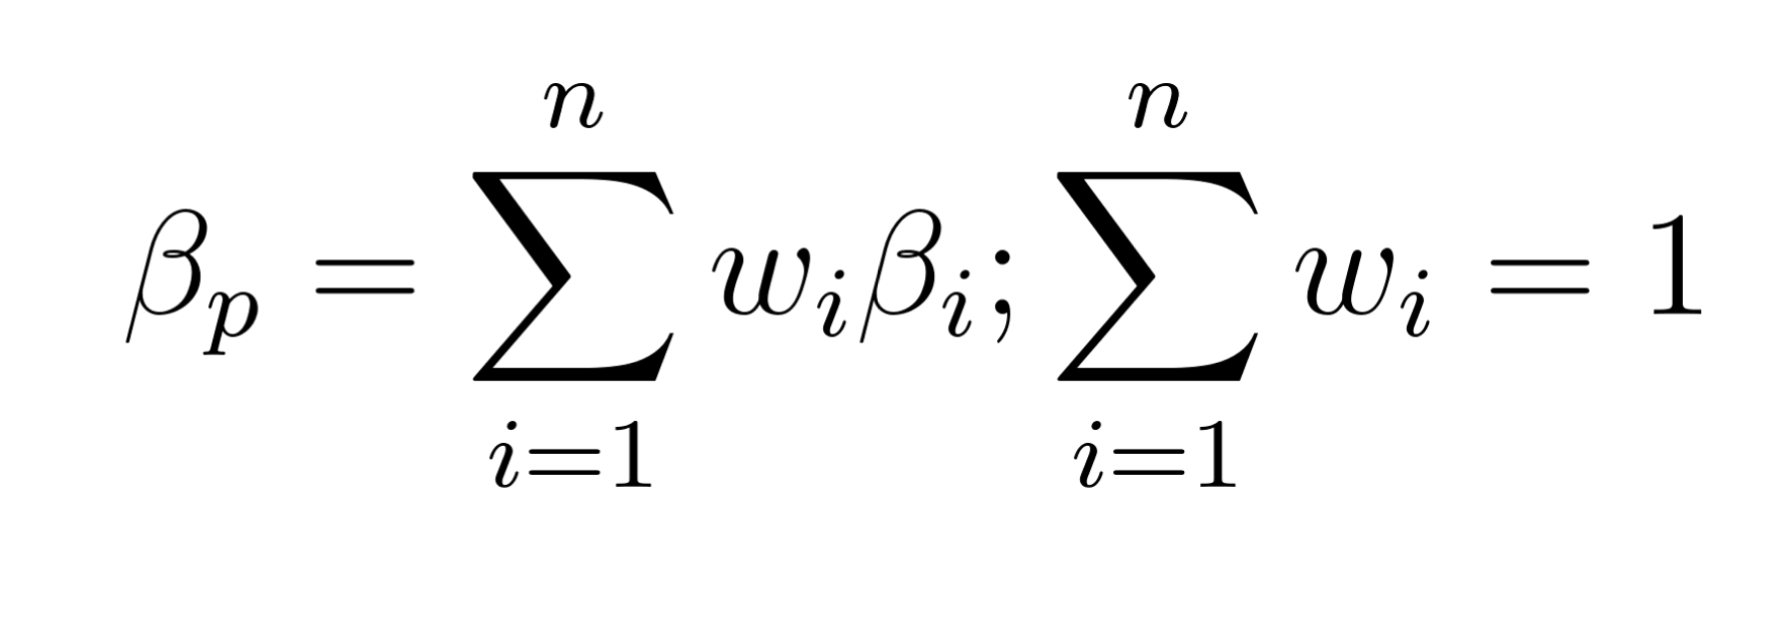
In the context of a portfolio of n assets, the portfolio’s return given by the CAPM can be easily calculated as:
where the portfolio beta is a weighted sum of the betas of the component assets and is given by:
Final thoughts
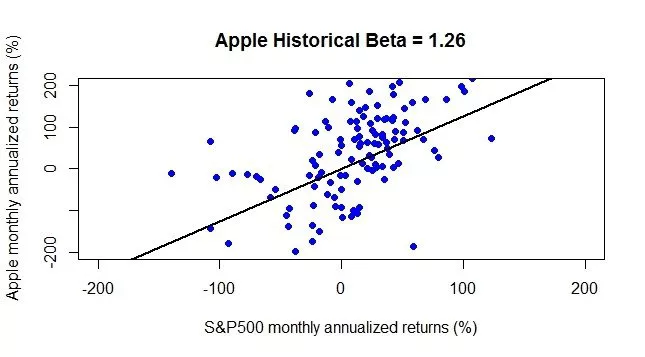
In conclusion, to use the CAPM model, three inputs are needed. First, a “riskless asset” (note that true risk can never be fully eliminated, only transformed) for which the investor knows with certainty the expected return for the time horizon of the analysis. Second, the risk premium, which is the premium demanded by investors for investing in the market portfolio instead of investing in a riskless asset. The premium is often estimated using historical data on the returns on risky assets and the riskless return. Third, beta, which is given by the covariance of the asset divided by the variance of the market portfolio. It can also be obtained directly by regressing past returns on the asset against past returns on the market portfolio (usually a stock index); the slope of the regression is the beta (see figure below).
Figure 7: Apple stock returns versus the S&P 500 returns helps illustrate beta of Apple as a slope of its regression line.
Source: Investopedia.
Generally, various risk and return models are predicated on the principle that only market-related risk is compensated. These models calculate expected return based on metrics that quantify this type of risk. Among these, the CAPM relies on the most assumptions but offers the simplest approach, employing just one factor to gauge and estimate risk.
Beta Dynamics in Crypto
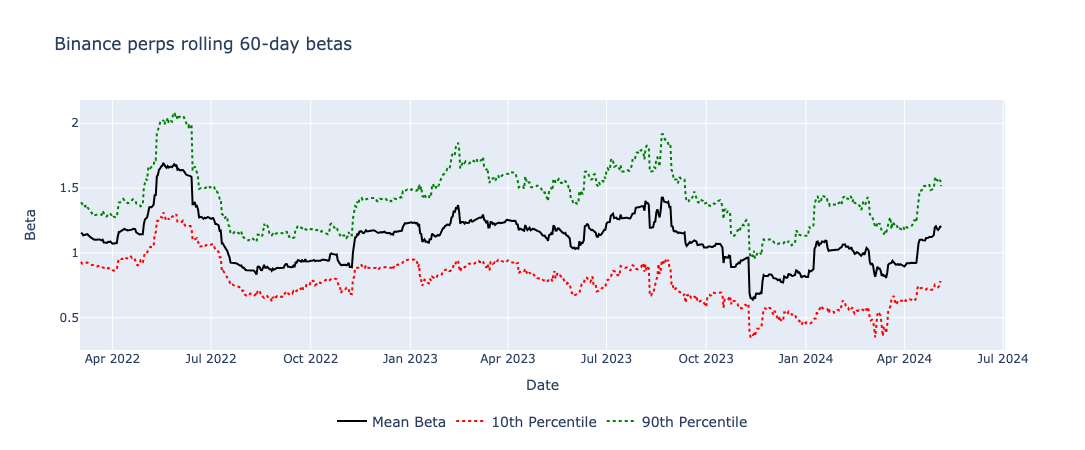
To provide some context on beta levels within crypto, historical data from Binance Perpetuals has been utilized, dating back to March 2022. This data covers tokens that have been actively traded since that time.
Rolling beta values were calculated over a 60-day window for each of these tokens. As a proxy for the market, an equally-weighted portfolio of $BTC and $ETH was used, given that these two tokens account for approximately 70% of the total market capitalization.
The figure below presents the rolling average, along with the 10th and 90th percentiles of betas for this universe of tokens. Notably, there was a peak in the average beta (exceeding 1.5) around May 2022, during the midst of the crypto bear market. Subsequent to this period, the average beta declined and eventually stabilized around 1.0.
Figure 8: Rolling (mean, 10th and 90th percentile) 60-day betas from Binance Perps subset
Source: Binance historical price data, Revelo Intel.
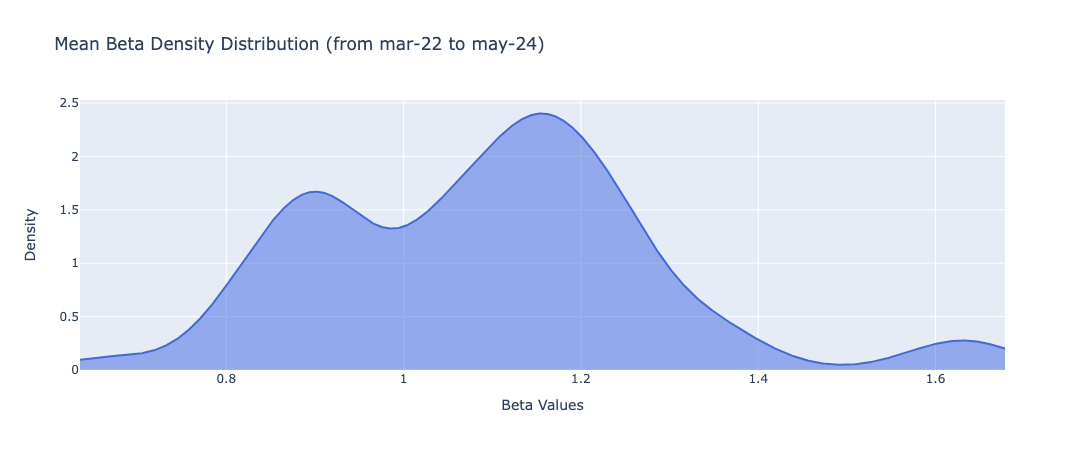
To further understand the beta dynamics, the figure below displays a probability density function that estimates the distribution of the average beta values across the tokens universe utilized for this analysis.
The peaks on the density curve, which are the most frequently observed beta values, occur at 1.15, 0.9, and 1.65, in descending order of prevalence. These data points confirm the well-noted fact that cryptocurrency tokens typically exhibit higher betas than the market portfolio, indicating greater volatility relative to the broader market. Finally, this variability in beta values underscores how the betas of cryptocurrency tokens are sensitive to changes in market conditions, reflecting their fluctuating risk profiles across different market regimes.
Figure 9: Mean beta density distribution of Binance Perps subset from mar-22 to may-24
Source: Binance historical price data, Revelo Intel.
Sector Outlook on Market Neutrality: Diverse Approaches in Long/Short Strategies.
Overview
Terms like long-short, market neutral, and dollar neutral investing are frequently used and often misunderstood as synonymous. However, these strategies can differ significantly. It is possible for a portfolio to be both long-short and dollar neutral while still possessing a nonzero beta to the market. This indicates that there is a market component influencing the portfolio’s return, meaning it is not truly market neutral.
To address these distinctions, we will employ terminology and classifications from traditional finance. Specifically, we will explore various strategies used by hedge funds and attempt to elucidate their differences.
In traditional finance, L/S strategies are commonly utilized by hedge funds and are categorized under “Equity Hedge” (EH) strategies. A wide variety of investment processes can be employed to arrive at an investment decision, including both quantitative and fundamental techniques; strategies can be broadly diversified or narrowly focused on specific sectors and can range broadly in terms of levels of net exposure, leverage employed, holding period, concentrations of market capitalizations and valuation ranges of typical portfolios.
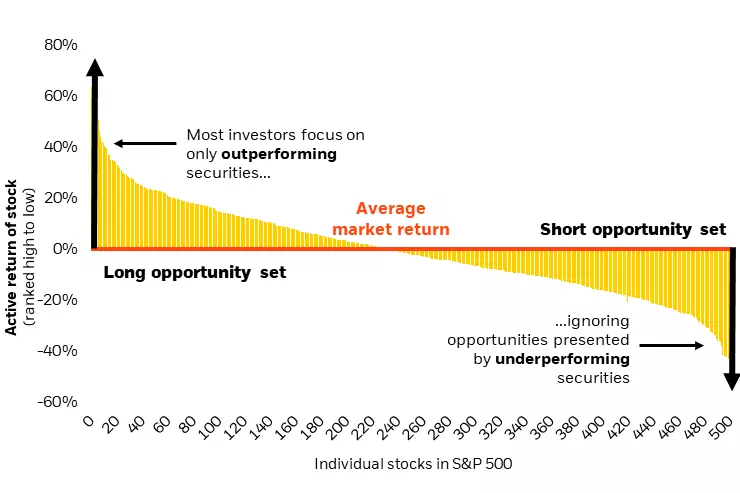
In general, these strategies compared to long-only ones tend to reduce overall portfolio risk (volatility) and are designed to target returns that are independent of market direction. This expands the opportunity set for return generation, allowing investors to express a broader range of active views (positive, less positive, or negative) across each stock in the investment universe.
Figure 10: Market Neutral Investing Expands Investment Opportunity Set
Source: BlackRock.com
EH strategies can be further broken down into seven distinct sub-strategies, each with its own unique characteristics. For the purposes of our discussion, however, we will classify them into two main types based on the degree of market neutrality they seek to attain.
Fundamental / Quantitative Directional strategies employ technical and fundamental analysis or sophisticated quantitative techniques to identify undervalued and overvalued companies, as well as to understand the relationships between different securities. Depending on the anticipated market direction and market cycle stage, hedge funds adjust their net long or short exposure. This method seeks to capitalize on market / sector trends and cycles by adjusting exposure levels accordingly.
Consequently, these funds often have a net long or a net short exposure, depending on the set of available opportunities and the manager’s outlook for the near term direction of the overall market. In either case, their portfolio performance becomes dependent upon directional market movements.
To reduce the consequences of a possible wrong stock selection, L/S equity managers diversify their portfolios, both on the long and on the short side.
On the other hand, Equity Market Neutral strategies involve using quantitative (technical) and/or fundamental analysis to distinguish between undervalued and overvalued equity securities. The goal is to maintain a market risk-neutral net position, striving for a portfolio beta close to zero. These strategies aim to profit from the movements of individual securities while neutralizing broader market risk.
When discussing market-neutral strategies, we often refer to approaches such as statistical arbitrage and pairs trading.
Statistical arbitrage refers to a broad range of strategies and investment approaches characterized by several key elements. Firstly, the trading signals are systematic and rule-based, rather than being influenced by fundamental analyses. Secondly, the portfolio maintains a market-neutral or beta-neutral stance. Thirdly, the generation of excess returns is primarily based on statistical methods. The objective is to place numerous bets, each with a positive expected return, leveraging diversification across various stocks to create a low-volatility investment strategy that remains uncorrelated with broader market movements. The duration of these holdings can vary widely, from mere seconds to several days, weeks, or even more extended periods.
Pairs-trading is widely assumed to be the “ancestor” of statistical arbitrage and tracks two historically correlated securities. When their correlation weakens (such as when one stock rises while the other falls) the strategy involves shorting the outperforming stock and buying the underperforming one, betting on the convergence of their spread. This divergence might result from temporary market fluctuations, significant orders, or impactful news about the companies. Trading groups of stocks against other groups of stocks is a natural extension of pairs-trading and it is referred to as “generalized pairs-trading”.
Figure 11: An example showing two price series of two assets whose price series moved together over a set historical period. The expectation is that after diverging, prices of chosen instruments will revert back to levels previously observed.
Source: Hudson and Thames.
Long and short positions are regularly balanced to remain market neutral at all times so that all of the portfolio’s return is derived purely from stock selection and no longer from market conditions. Indeed, when correctly implemented, it offers the promise of true absolute returns (the alpha) without having to bear the market sensitivity (the beta).
However, it is worth noticing the term “market neutral” has evolved into a broader term that embeds several different investment approaches with varying degrees of risk and neutrality, as we will discuss below.
Dollar Neutrality
To be dollar neutral, we need to have equal dollar investments in the long and the short positions, say for instance $100k long and $100k short. Going forward, we will also need to rebalance our long and our short positions on a regular basis to maintain dollar neutrality. Indeed, if we were right in our asset selection, the long position will appreciate while the short position will shrink in size, pushing the portfolio towards a net long bias.
Dollar neutrality is extremely appealing because of its simplicity. It has the great benefit of being directly verifiable, as the initial value of the investments is observable. However, as discussed later, it is not sufficient to make a portfolio market-neutral.
Beta Neutrality
A commonly used risk-based definition of market neutrality relies on beta: a portfolio is said to be market neutral if it generates returns that are uncorrelated with the returns on some market index.
Since beta is calculated from the correlation coefficient, a zero correlation implies a zero beta. As anticipated in the previous sections, the volatility of an asset (or a portfolio of assets) can be decomposed into a systematic (market risk) component and an unsystematic (specific risk) component. The systematic component depends on the volatility of the markets as well as on the market risk exposure, which is measured by the beta coefficient. The unsystematic component is independent from the market and it normally gets diversified away at the portfolio level.
The beta of an equities portfolio is a weighted average of the betas of its constituent stocks. Consequently, being dollar-neutral does not necessarily guarantee that the portfolio will be insensitive to the market return, i.e. will have a beta equal to zero. It all depends on the beta of the long and the short positions. For instance, if the beta of the long position is 1.4 and the beta of the short position is 0.7, an equal dollar allocation between the two will have a net beta of 0.35 = (50%) × (1.4) − (50%) × (0.7). This positive beta indicates that the market risk of our dollar-neutral portfolio is not zero, and it actually has a positive correlation with the equity markets.
To make our portfolio really beta-neutral, we need to size the long and short positions adequately. In our example, given the ratio of the two betas (1.4 versus 0.7), we would need to double the size of the short position relative to the long position. That is, for any dollar in the long position, we would need to have two dollars in the short position. In this case, the beta will be exactly zero, which means that the systematic risk of the portfolio has been neutralized.
Going forward, if our long position appreciates in value and our short position decreases in value, we would still need to adjust the size of our positions on a regular basis to avoid the drift toward a positive beta.
Final Thoughts
To sum up, L/S strategies are employed through various methods and techniques. Their primary aim is to construct a portfolio of long and short positions that fine-tunes the desired market exposure, ranging from a directional bias to market neutrality.
These strategies are so attractive to investors for numerous reasons such as:
- Reduced market risk: by constructing a portfolio that is (near) beta-neutral, an investor can reduce his exposure to market risk, making the portfolio less volatile in respect to the market.
- Increased diversification: a beta-neutral portfolio typically involves investing in a mix of assets with different levels of beta. This can lead to increased diversification, which can help reduce the overall risk of the portfolio.
- Improved risk-adjusted returns: by balancing the portfolio’s beta, investors can potentially achieve better risk-adjusted returns. This means that the returns achieved by the portfolio are higher relative to the amount of risk taken on.
- Potential for alpha generation: by actively managing the portfolio’s beta exposure, investors may be able to generate alpha, or excess returns above a benchmark. This can be achieved through skilled security selection and/or market timing, which can lead to outperformance relative to the broader market regardless of its direction.
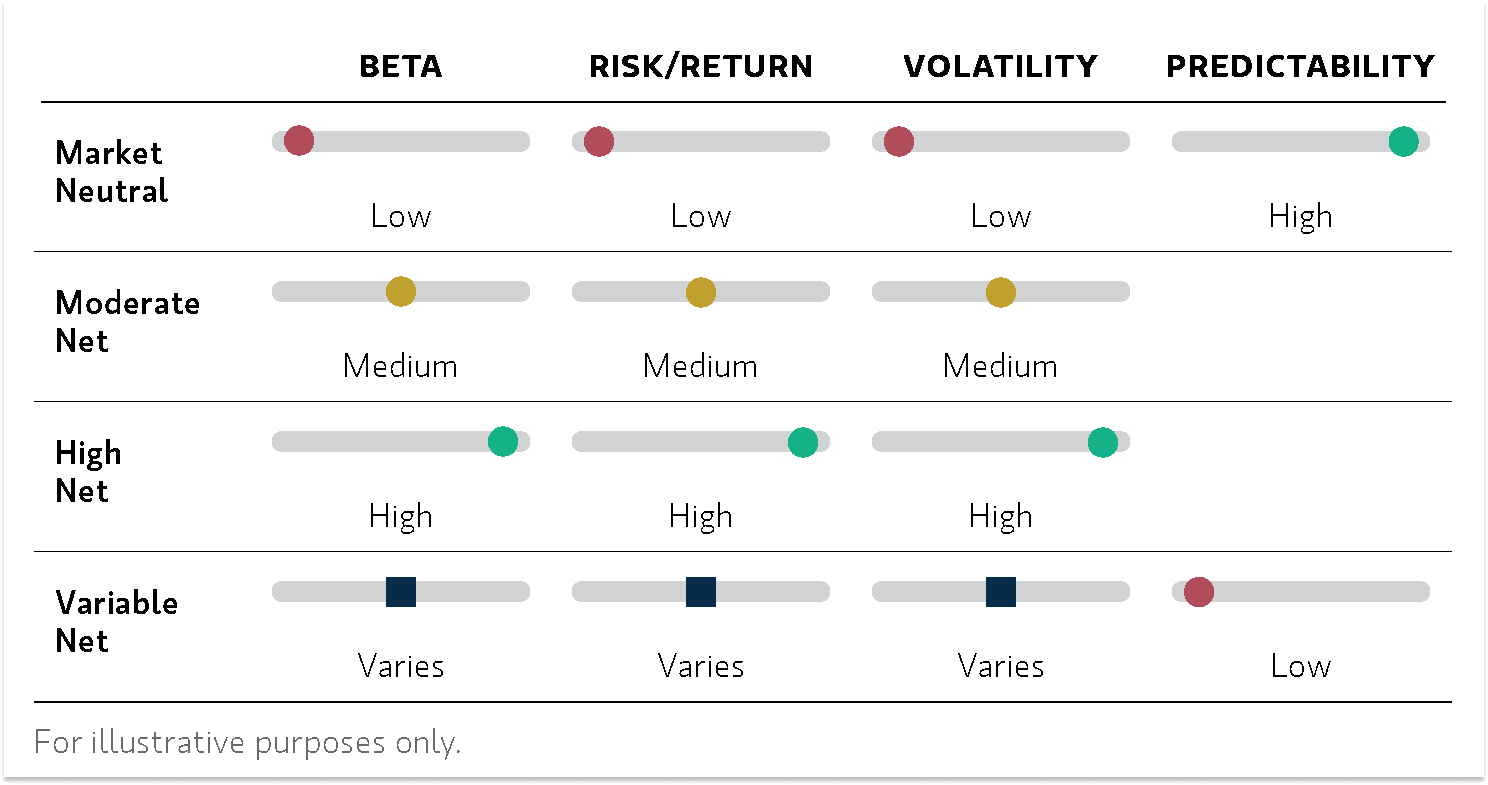
Figure 12: Characteristics of Long/Short strategies in terms of different market neutrality levels
Source: MorganStanley.com
In the context of cryptocurrencies (a notably volatile asset class) utilizing these strategies can offer significant benefits. Investors can express their views and strategies in diverse ways, such as pairs trading, narrative-based trading, sector rotations, and trading based on news events.
Use Case: Three Long/Short Portfolios for Narrative Trading
In this section, it is discussed the application of three simple L/S strategies in the cryptocurrency market, focusing on the performance and risk dynamics of portfolios with different market exposure objectives.
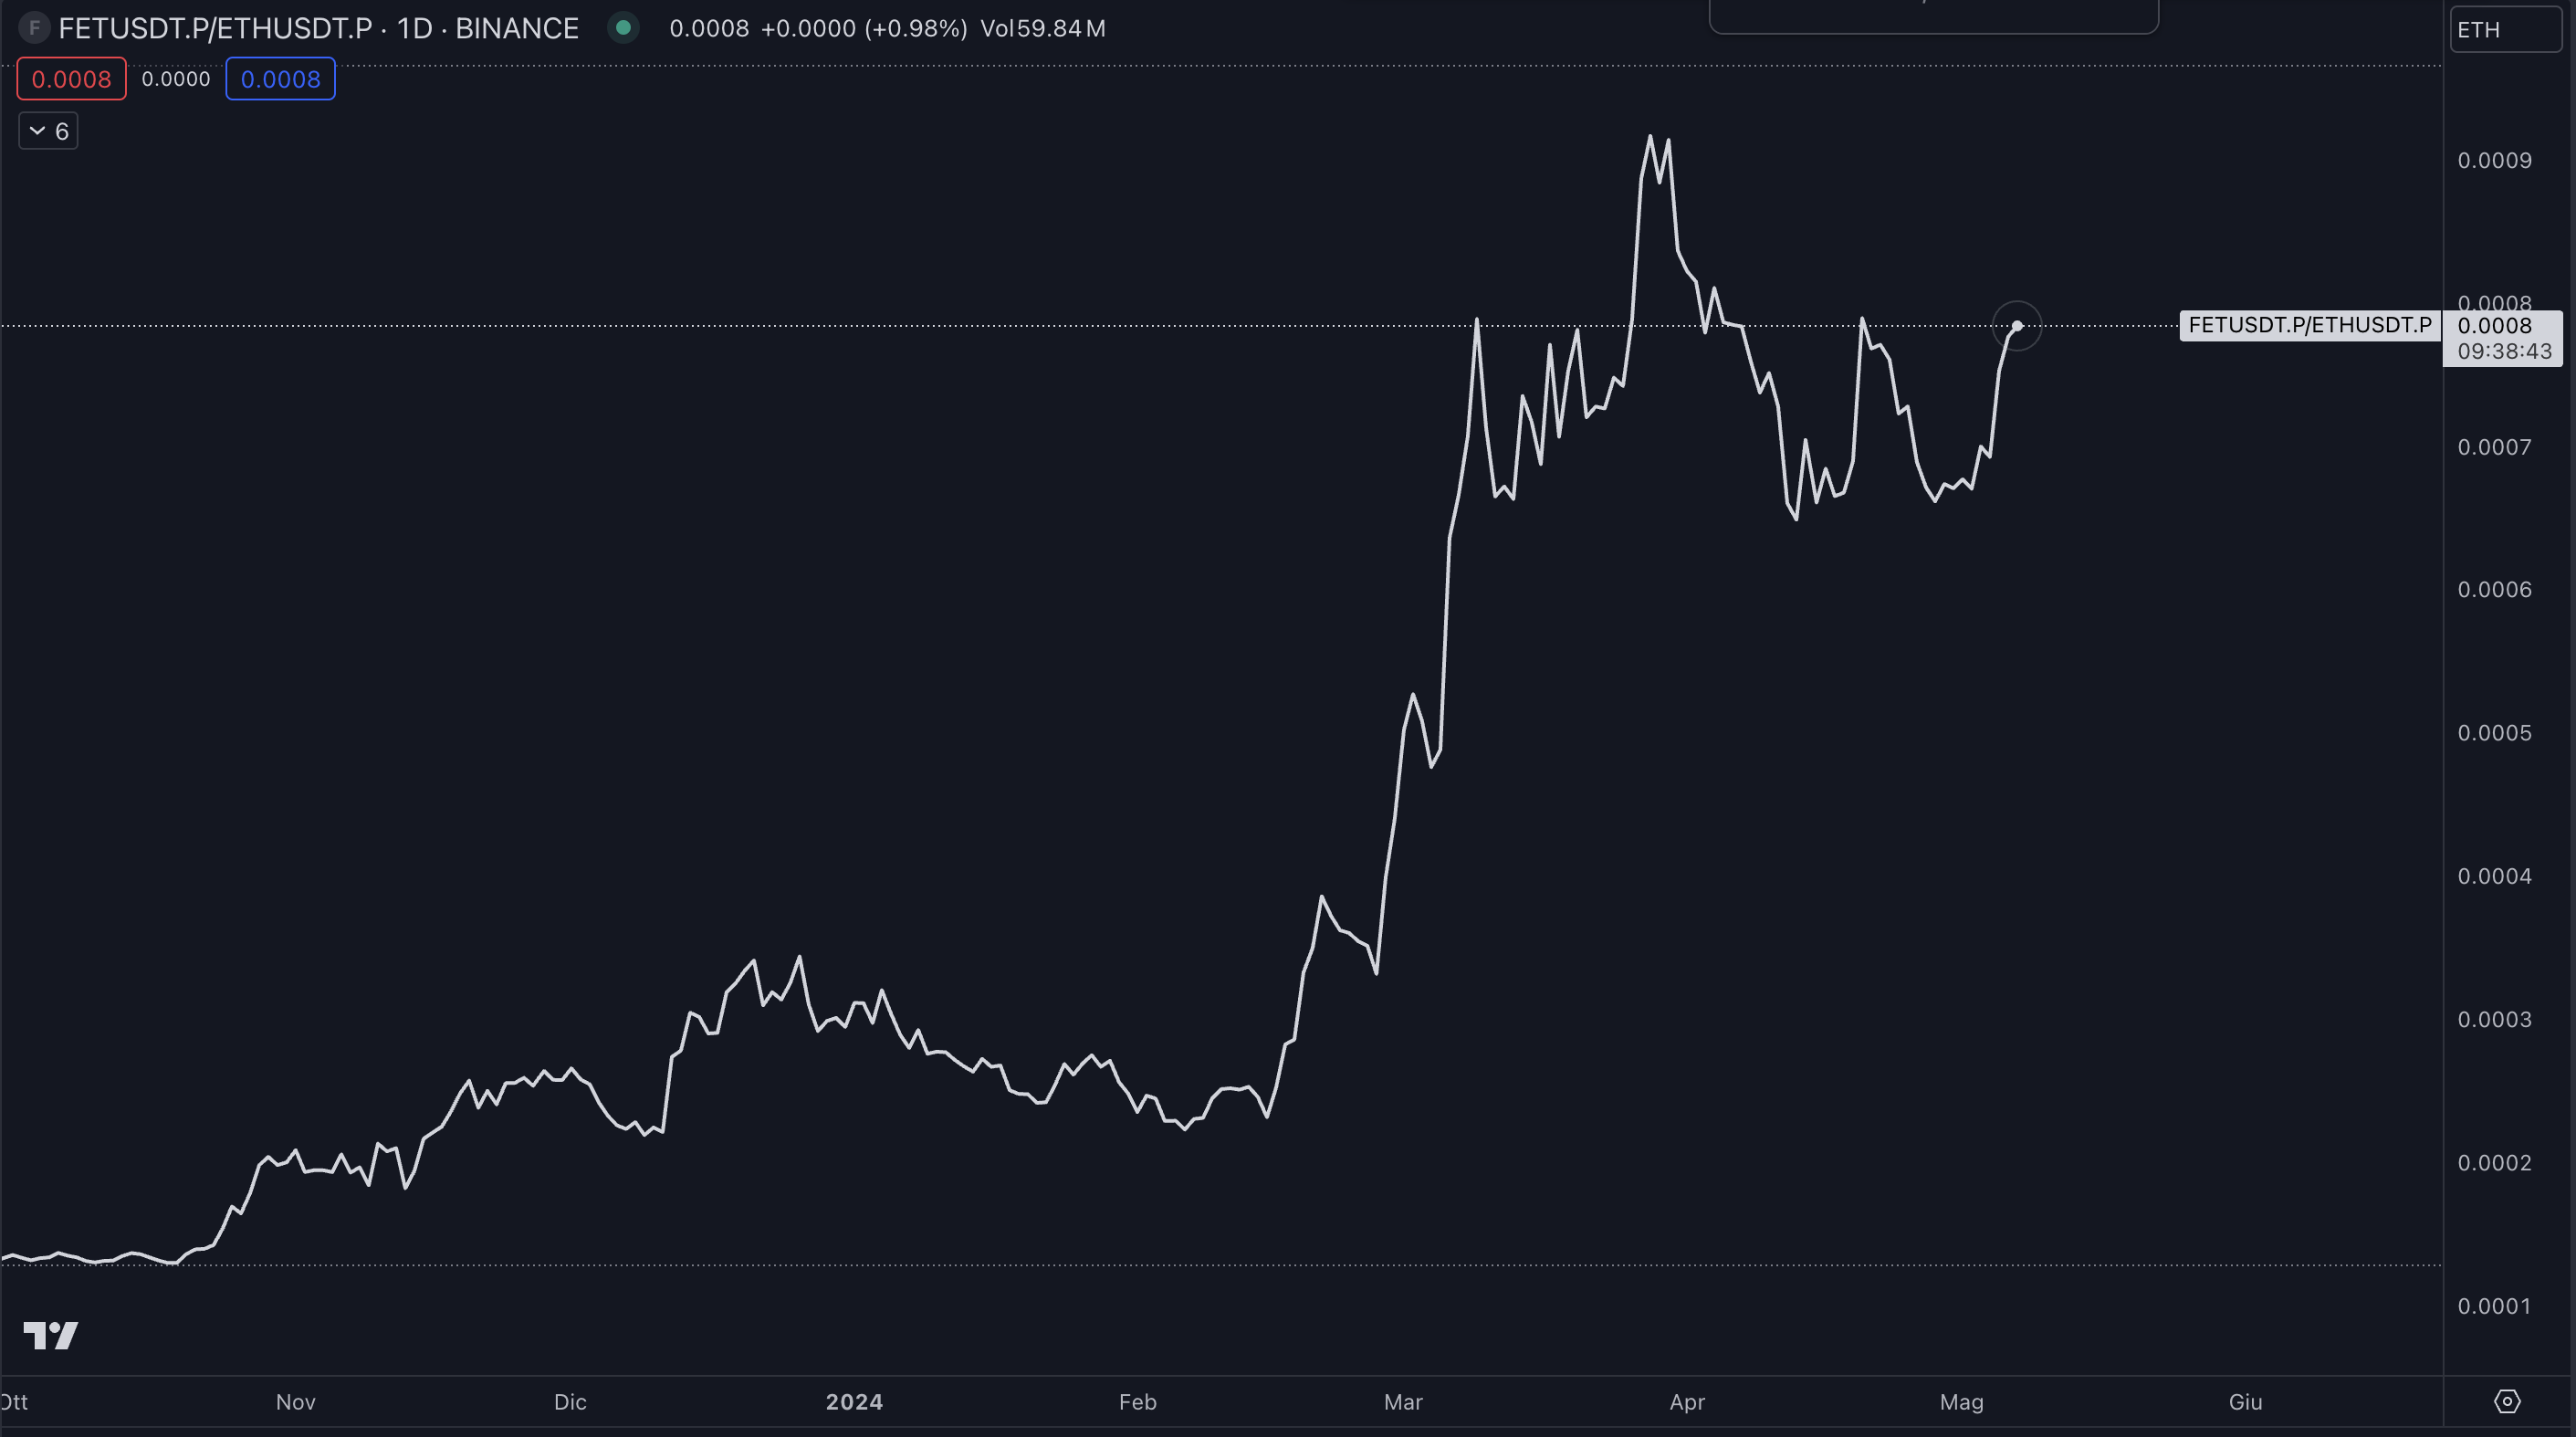
The analysis centers around constructing three distinct portfolios involving FETUSDT (AI sector) and ETHUSDT. The goal is to investigate how different strategies could have exploited the AI narrative by going long on $FET while simultaneously shorting $ETH while using different degrees of market neutrality.
Figure 13: Capitalizing on the AI narrative relative performance (FET/ETH)
Source: TradingView.
Three portfolios were designed with varying objectives:
- Portfolio 1: targeting a beta = 0
- Portfolio 2: dollar-neutral exposure
- Portfolio 3: targeting a beta = 0.5
These portfolios were constructed with the following characteristics and assumptions:
- Beta: rolling beta was computed over a 60-day window.
- Rebalancing: daily rebalancing was implemented to adjust the portfolio weights according to the predefined risk parameters and to maintain the intended market exposure.
- Leverage: a maximum leverage of 1.
- Analysis period: the portfolios were evaluated from October 2023 to May 2024, capturing significant market movements and trends relevant to the AI sector.
The use case underscores the strategic utility of L/S portfolios in managing exposure and risk in the volatile cryptocurrency markets. By employing different beta targets or a dollar-neutral approach, investors can fine-tune their market exposure and risk levels according to their risk appetite and market outlook.
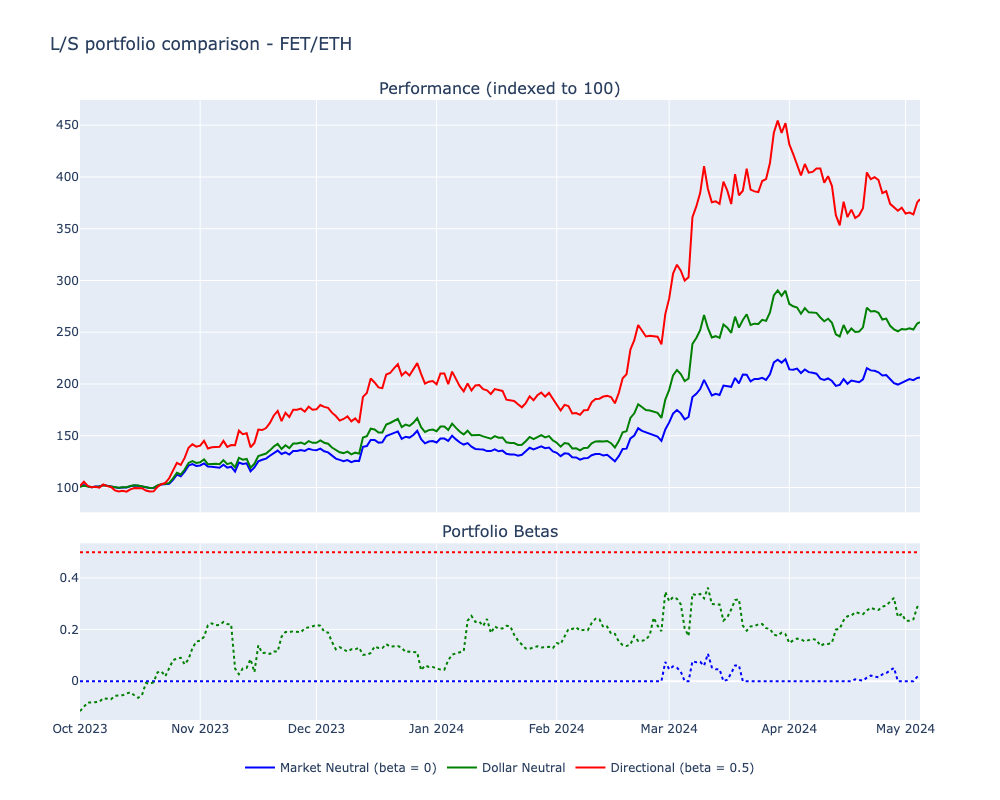
The figure below illustrates the performance differences among the three portfolios. From the ‘Portfolio Betas’ subplot, it is evident that the portfolios designed to target specific betas effectively maintain their intended exposures. However, as illustrated in the “Dollar Neutrality” section, the dollar-neutral portfolio exhibits variable betas (green line), indicating a moderate directional long bias, which subtly influences its overall performance and places it between the beta-neutral portfolio (blue line) and the portfolio targeting a beta of 0.5 (red line).
Figure 14: AI narrative trade (FET/ETH) – Comparison of three L/S Portfolios
Source: Binance historical price data, Revelo Intel.
As anticipated, Portfolio 1 (beta = 0) demonstrated the lowest volatility, indicating its effectiveness in market risk mitigation. This was followed by Portfolio 2 (dollar-neutral portfolio), which exhibited moderate volatility due to its variable beta. Lastly, Portfolio 3 (beta = 0.5), which aimed to maintain a higher beta, showed the greatest volatility among the three portfolios.
In hindsight, focusing solely on a long position in $FET would have resulted in higher profits, benefiting from the bullish AI narrative throughout the analysis period. Nonetheless, this strategy also led to substantially higher volatility and nearly doubled the drawdowns, clearly illustrating the inherent trade-off between risk and return.
Figure 15: L/S portfolios vs FETUSDT performance metrics
Source: Binance historical price data, Revelo Intel.
Conclusion
This report has explored the concept of relative asset performance, emphasizing the construction of L/S portfolios to capitalize on the performance differences between assets. We began by revisiting foundational concepts through the Capital Asset Pricing Model (CAPM), including beta and the market portfolio, which are crucial in developing L/S strategies.
We also discussed the various strategies used by hedge funds to create L/S portfolios with varying levels of market neutrality. Drawing on traditional finance experience, these strategies illustrate different approaches to market engagement.
Further, we presented a practical use case within the cryptocurrency markets, analyzing the dynamics of average betas from 2022 to the present for a selection of perpetual contracts. Besides, we developed three straightforward L/S strategies that demonstrate how a basic narrative trading strategy could have been implemented.
Overall, L/S strategies offer a robust framework for navigating the volatile crypto markets under any condition. These strategies allow investors to tailor their approaches from technical/statistical angles to more fundamentals and narrative/sector trading perspectives, offering several advantages such as reduced market risk, enhanced diversification, improved risk-adjusted returns, and the potential for alpha generation. L/S strategies are versatile tools in an investor’s toolbox, applicable with varying degrees of complexity, as we will continue to explore in upcoming reports in this series.
References
- Avellaneda M., Lee J.H., (2008) Statistical Arbitrage in the U.S. Equities Market, SSRN. Available online at: ssrn.com
- Bernstein P.L., Damodaran A., (1998) Investment Management. Wiley. Available online at: wiley.com
- CFA Institute, (2015) Corporate Finance and Portfolio Management. Wiley.
- CFA Institute, (2015) Derivatives and Alternative Investments. Wiley.
- Dalio R., (2017) Principles: Life and Work. Avid Reader Press / Simon & Schuster. Available at: amazon.com
- Equity Long-Short, (2012) BarclayHedge.com. Available online at: barclayhedge.com
- Ganapathy V., (2011) Pairs Trading: Quantitative Methods and Analysis. Wiley Finance. Available online at: wiley.com
- HFR Hedge Fund Strategy Classification System. Available online at: hfr.com
- Lhabitant F.-S., (2006) Handbook of hedge funds. Wiley Finance. Available online at: wiley.com
- Market neutral investing in a new regime, (2023). BlackRock. Available online at: blackrock.com
- Stampfel E., (2023) Long Short Equity Strategies: “Hedging” Your Bets. Available online at morganstanley.com.
- Statistical Arbitrage Laboratory. Hudson and Thames, Available online at: hudson-and-thames
- Valuation Models: Apple’s stock analysis with CAPM, (2022). Available online at: Investopedia.com
- Why pair trade, if I can just giga long?, (2024). Available online at: Pear Protocol
Disclosures
Revelo Intel is engaged in a commercial relationship with Pear Protocol as part of an educational initiative and this report was commissioned as part of that engagement.
Members of the Revelo Intel team, including those directly involved in the analysis above, may have positions in the tokens discussed.
This content is provided for educational purposes only and does not constitute financial or investment advice. You should do your own research and only invest what you can afford to lose. Revelo Intel is a research platform and not an investment or financial advisor.


